kubernetes 中的垃圾回收机制

一、概述

一个运行中的 kubernetes 集群,存储了非常多的相互关联的资源,比如我们常用的 deployment,replicaset 和 pod,就是一组有关联的资源。我们在创建 deployment 时,相关的控制器就会自动创建出 replicaset,之后 replicaset 的控制器又会创建出 pod 来运行我们部署的服务。那么同样的,我们肯定也希望在删除 deployment 之后,会自动删除 replicaset 和 pod。这个机制就叫做垃圾回收(下面简称 GC)。

在早期的版本中,GC 是由客户端实现的,比如使用 kubectl delete deployment nginx 这样的命令,kubectl 会删除 pod 和 replicaset。但是这种方式增加了客户端的实现复杂度,不利于统一管理。因此提出了在服务端实现 GC 的需求。实现 GC 有三个主要目标,我们在之后分析的时候,也主要是围绕这三个主要目标进行。

  • 在服务端支持级联删除
  • 中心化级联删除的逻辑,而不是分布在各个组件内
  • 可以选择不删除被依赖的资源。如只删除 deployment,但是保留 replicaset 和 pod

kubernetes 的 GC 是在 controller manager 中,作为一个单独的 controller 来实现的。它通过 discovery client 来动态发现并监听集群中所有支持 delete,listwatch的资源。然后构造资源之间的关系图来记录资源之间的依赖关系。

二、预备知识

为了更好的阐述 kubernetes 的 GC 机制,这里先将一些 k8s 基本知识做一些阐述。

  • finalizer: finalizer 可以翻译为终结期。是一种用来保证资源在被删除之前,能够有机会做一些清理工作的机制。
  • kubernetes 的删除传播策略有三种:
    1. Orphan. 这种策略下,会保留被依赖的资源。如只删除 deployment,但是保留 replicaset 和 pod。
    2. Background. 从 etcd 中删除资源,被依赖的资源由 GC 机制来删除。
    3. Foreground. apiserver 不会删除该资源。而是在它的 finalizer 中添加 foregroundDeletion,并且设置当前的删除时间戳。然后 GC 会先从 etcd 中删除有 ownerReference.blockOwnerDeletion=true 的被依赖资源。最后再删除当前资源。
  • UID。k8s 中的每个资源都有一个唯一的 UID。这个 UID 在整个集群的生命周期中,对于每一个资源来说都是唯一的。所有在标记资源的依赖关系时,需要使用 UID。
  • ownerReferences。每个资源的 metadata 中都会有这个字段,它是一个数组,用来表示该资源的 owner 有哪些。每当 owner 资源被删除,就会从这个数组中移除。当所有的 owner 都被删除后,GC 就会回收该资源。
  • Dependents。如果一组资源 G 的 ownerReference 指向某个具体的资源 A。那个 A 的 dependents 就是 G

三、垃圾回收的实现机制

kubernetes 的 GC 主要由两部分组成:

  • GraphBuilder 主要用来使用 monitors 监听 apiserver 上的所有资源,通过将所有资源的事件插入到 graphChanges 队列中,然后调用 processGraphChanges 方法,从队列中依次取出元素,构建资源之间的依赖关系。并根据情况插入到 attemptToDelete 或 attemptToOrphan 队列中。
  • GarbageCollector 负责从 attemptToDelete 和 attemptToOrphan 队列中取出资源,然后通过一系列负责的过程,判断是否能删除,并进行相关的处理。

因此,对于垃圾回收实现机制的分析,主要从这两部分进行。

3.1 graph builder 的实现

graph builder 可以看做是集群资源状态的维护者。其本身并不会通过 apiserver 修改任何的资源。其定义如下:

// GraphBuilder 处理 informers 提供的事件,更新 uidToNode,使用 LRU 缓存依赖资源,并将
// 资源送入到 attemptToDelete 和 attemptToOrphan 队列
type GraphBuilder struct {
    restMapper meta.RESTMapper

  // 每个 monitor 都会 list/watches 一个资源,结果会被导入到 dependencyGraphBuilder 中·
    monitors    monitors
    monitorLock sync.RWMutex

    informersStarted <-chan struct{}
    stopCh <-chan struct{}
    running bool

    metadataClient metadata.Interface
  // monitors 是该队列的生产者,graphBuilder 根据这些改变来修改内存中的 graph
    graphChanges workqueue.RateLimitingInterface
  // 资源 uid 对应到 graph 中的 node
    uidToNode *concurrentUIDToNode
  // GraphBuilder 是 attemptToDelete 和 attemptToOrphan 的生产者,GC 是消费者。
    attemptToDelete workqueue.RateLimitingInterface
    attemptToOrphan workqueue.RateLimitingInterface
  // GraphBuilder 和 GC 共享 absentOwnerCache. 目前已知的不存在的对象会被添加到缓存中
    absentOwnerCache *UIDCache
    sharedInformers  controller.InformerFactory
    ignoredResources map[schema.GroupResource]struct{}
}

组成 graph 的 node 定义如下:

// 单线程的 GraphBuilder.processGraphChanges() 是 nodes 的唯一 writer。多线程的 GarbageCollector.attemptToDeleteItem() 读取 nodes。
type node struct {
    identity objectReference
    dependentsLock sync.RWMutex
    // dependents 是当前 node 的依赖资源。比如当前 node 是 replicaset,那么这里面保存的应该就是多个 pod
    dependents map[*node]struct{}
    // this is set by processGraphChanges() if the object has non-nil DeletionTimestamp
    // and has the FinalizerDeleteDependents.
    deletingDependents     bool
    deletingDependentsLock sync.RWMutex
    // this records if the object's deletionTimestamp is non-nil.
    beingDeleted     bool
    beingDeletedLock sync.RWMutex
    // this records if the object was constructed virtually and never observed via informer event
    virtual     bool
    virtualLock sync.RWMutex
    // when processing an Update event, we need to compare the updated
    // ownerReferences with the owners recorded in the graph.
    owners []metav1.OwnerReference
}

GraphBuilder 会和 apiserver 同步 monitors,然后为每种资源创建一个 monitor,通过 informer 同步资源的状态。所有的资源都会直接进入 graphChanges 队列。然后在 processGraphChanges 方法中统一处理。

对于 Add 和 Update 事件:

  • 如果当前资源不存在 graph 中,就会实例化出一个 Node 对象,加入到 graph 中。然后将该 node 加入到其 owners 的 dependents 数组中。 这里有一个细节,就是有可能出现一种情况,当前 node 所代表的资源通过 informer 被同步到本地缓存中,但是其 owner 还没有被同步过来。这样更新 owners 的 dependents 就会有遗漏。因此每个 node 都有一个 virtual 字段,在 owner 还没有被同步时,实例化一个虚拟的 owner node 加入到 graph 中。并且将这个虚拟 node 添加到 attemptToDelete 队列中,由之后的 GC 处理。如果这个虚拟 node 在之后被 processGraphChanges 发现了,就会调用 markObserved() 将 virtual 置为 false。
  • 如果已经存在了,那么就要比对新旧资源的 ownerReferences 的变化情况。这里会计算出 added, removed 和 changed。ownerReferences 的变化可能会带来以下要处理的情况。
    • 之前提到 Foreground 的删除,ownerReference 带有 blockOwnerDeletion=true 的资源会 block 的 owner 的删除。那么这里因为 ownerReferences 的变化,需要做以下两点:
    • 对于 removed 的 ownerReference,如果 blockOwnerDeletion 为 true。就说明当前不允许再 block 该 node owner 的删除。因此将 owner 放到 attemptToDelete 队列中,等待 GC 的处理。
    • 对于更新的 ownerReference,如果之前 blockOwnerDeletion 为 true,现在为 false,那么也要加入到 attemptToDelete 队列。
    • 对于 added 和 removed,都需要更新对应的 owner node 的 dependents。
  • 无论是 Add 还是 Update 事件,都会调用 processTransitions 方法,
    • 如果 old object 没有被删除或者没有 orphan finalizer,但是 new object 被删除了或者有 orphan finalizer,就会将该节点插入到 attemptToOrphan 队列。
    • 如果 old object 没有被删除或者没有 foregroundDeletion finalizer,但是 new object 被删除了或者有 foregroundDeletion finalizer,就会将该节点的 dependents 都插入到 attemptToDelete 队列,再将节点插入到 attemptToDelete 队列。

对于删除事件

  • 会从当前的 graph 中移除该 node。起始就是从 uidToNode 中删除该 node,然后更新所有的 owner 的 dependents。
  • 如果当前 node 的 dependents 大于 0,就将当前 node 添加到 absentOwnerCache 中。
  • 将该 node 的 dependents 将入到 attemptToDelete 队列中(垃圾回收)。
  • 最后,从该 node 中找到处于 deletingDependents=true 状态的 owner,也插入到 attemptToDelete 队列中。这里是为了让 GC 检查该 owner 是不是所有的 dependents 都被删除了,如果是,就将该 owner 也删除(这里 owner 处于 deletingDependents,说明使用了 foregroundDeletion,因此需要先删除 dependents,再删除 owner)。

因此可以知道,以下状态的资源会被插入到 attemptToDelete 队列中:

  • finalizers 中有 foregroundDelete
  • owner 的 finalizers 中有 foregroundDelete
  • owner 资源被删除
  • Dependents 中有资源被删除,并且当前状态还不是正在删除 deletingDependents
  • owner 处于 deletingDependents

以下状态的资源会被插入到 attemptToOrphan 队列中:

  • finalizers 中有 orphan

3.2 GarbageCollector 的实现

在 3.1 中提到,GC 会消费 GraphBuilder 的 attemptToDelete 和 attemptToOrphan 队列,来执行 delete 或 orphan 操作。因此我们这里主要关心,什么样的资源可以被 GC delete 或者 orphan。

3.2.1 attemptToDeleteItem

  • 对于 DeletionTimestamp 不为空,并且不处于删除 dependents 的资源。直接跳过处理流程。
  • 如果资源处于 deletingDependents 状态,则统计 blockOwnerDeletion=true的 dependents 个数。
    • 如果为 0,说明当前资源可以删除了,则移除 foregroundDeletion 这个 finalizer 即可。
    • 否则将 dependents 插入到 attemptToDelete 队列中
    • 之后会退出这个循环
  • 对资源的 ownerReferences 进行分类
    • Dangling: owner 对应的资源实际已经不存在了。
    • waitingForDependentsDeletion: owner 的 DeletionTimeStamp 不为空,但是有 foregroundDeletion,所以正在等待 dependents 删除
    • solid: owner 存在,并且不是 waitingForDependentsDeletion
  • 如果 solid 不为空,那么当前资源就不能被 GC,因此只需要通过 patch 来移除 dangling 和 waitingForDependentsDeletion 的 ownerReferences
  • 如果 waitingForDependentsDeletion 不为空并且当前资源的 dependents 不为空。这个判断用来处理循环依赖的异常情况,因为当前资源并不处于删除状态且有 dependents,其 owner 又在等待该 item 的删除,说明这里有一个循环依赖。解决办法就是通过 patch 去更改该资源的 blockOwnerDeletion 为 false。
  • 如果上面两种情况都不是。就会根据当前资源的 finalizer 来删除资源
    • orphan
    • foreground
    • Background

因此可以得出,以下状态的资源会被 GC 调用删除请求:

  • 资源处于 deletingDependents 状态,且其没有 dependents 的 blockOwnerDeletion 为 true。先移除 foregroundDeletion finalizer,然后删除
  • 资源的 owner 和 dependents 都有 blockOwnerDeletion。如果 dependents 处于 deletingDependents 状态。为了防止存在循环依赖,会先把 owner 的 unblock。然后使用 foreground 来删除当前资源。
  • 资源没有 solid 的 owner,那么这个资源就是应该被级联删除的资源。所以根据该资源的 finalizer 来删除。默认使用 background 的方式删除。

3.2.2 attemptToOrphan

orphan 是防止某些情况下资源被 GC 回收的方式。attemptToOrphan 的逻辑要简短一些,如下:

  • 移除 dependents 对当前资源 ownerReferences
  • 移除该资源的 orphan finalizer (这个更新事件会被 GraphBuilder 获取到,然后该资源符合进入 attemptToDelete 队列的条件。之后再由 GC 的处理,最终会被删除。)

总结

根据以上流程,附上自己整理的一个整体的 GC 流程图

k8s-gc

参考

garbage collection

k8s 中删除 namespace 时发生了什么

一、概述

namespace 是 kubernetes 中一个比较重要的概念,是对一组资源和对象的抽象,也常用来作不同用户的隔离。namespace 下有很多资源,比如我们常用的 deployment, pods, service, ingress, configmap 等等。

当然本篇文章的重点在于删除 namespace 时发生了什么?一个很典型的场景是在终端中执行 kubectl delete ns test 时,我们会观察到,在执行命令后,test 命名空间会立刻进入 terminating 状态,在几秒钟之后,才会被真正删除。即使 test 命名空间中没有任何资源。

NAME              STATUS   AGE
default           Active   2d2h
docker            Active   2d2h
kube-node-lease   Active   2d2h
kube-public       Active   2d2h
kube-system       Active   2d2h
test              Active   4s
test              Terminating   18s
test              Terminating   23s

因此,我们在下面会探究以下几点:

  • api-server 如何处理 namespace 的删除请求
  • 删除 namespace 时如何处理其中的资源

二、api server 如何处理 namespace 删除请求

和其他资源不同,namespace 在删除时,需要先清空 namespace 下资源。因此 namespace 有两种状态,即 active 和 terminating。当 namespace 处于 terminating 时,说明其下的资源还没有被确认删除干净。因此,api-server 在收到 namespace 的删除请求时,并不会立刻将其从 etcd 中删除,而是先检查 metadata.DeletionTimestamp 是否为空,如果为空,则是先将 metadata.DeletionTimestamp 置为当前时间,然后将 status.Phase 置为 terminating。如果 metadata.DeletionTimestamp 不为空,还要再判断 spec.Finalizers 是否为空。如果为空,才会真正的删除该 namespace。

这样的处理方式,就保证了在 spec.Finalizers 不为空时,namespace 不会被删除。那么 finalizer 是在什么时候添加的呢?具体的作用是怎么体现的?

三、finalizer 机制

namespace 的 finalizer 其实在创建的时候就已经添加上去了。处理逻辑可见以下代码:

// PrepareForCreate clears fields that are not allowed to be set by end users on creation.
func (namespaceStrategy) PrepareForCreate(ctx context.Context, obj runtime.Object) {
    // on create, status is active
    namespace := obj.(*api.Namespace)
    namespace.Status = api.NamespaceStatus{
        Phase: api.NamespaceActive,
    }
    // on create, we require the kubernetes value
    // we cannot use this in defaults conversion because we let it get removed over life of object
    hasKubeFinalizer := false
    for i := range namespace.Spec.Finalizers {
        if namespace.Spec.Finalizers[i] == api.FinalizerKubernetes {
            hasKubeFinalizer = true
            break
        }
    }
    if !hasKubeFinalizer {
        if len(namespace.Spec.Finalizers) == 0 {
            namespace.Spec.Finalizers = []api.FinalizerName{api.FinalizerKubernetes}
        } else {
            namespace.Spec.Finalizers = append(namespace.Spec.Finalizers, api.FinalizerKubernetes)
        }
    }
}

然后在删除时 namespace 变更到 terminating 状态,namespace controller 就开始发挥作用了。namespace controller 属于 controller manager,其会监听 namespace 的 add 和 update 事件

    // configure the namespace informer event handlers
    namespaceInformer.Informer().AddEventHandlerWithResyncPeriod(
        cache.ResourceEventHandlerFuncs{
            AddFunc: func(obj interface{}) {
                namespace := obj.(*v1.Namespace)
                namespaceController.enqueueNamespace(namespace)
            },
            UpdateFunc: func(oldObj, newObj interface{}) {
                namespace := newObj.(*v1.Namespace)
                namespaceController.enqueueNamespace(namespace)
            },
        },
        resyncPeriod,
    )

并且会使用 workqueue 来保存每一个 namespace 的变化事件。然后统统触发 nm.namespacedResourcesDeleter.Delete(namespace.Name)。当然,如果 namespace 不存在或者 namespace.DeletionTimestamp 为空,则会退出:

    namespace, err := d.nsClient.Get(context.TODO(), nsName, metav1.GetOptions{})
    if err != nil {
        if errors.IsNotFound(err) {
            return nil
        }
        return err
    }
    if namespace.DeletionTimestamp == nil {
        return nil
    }

否则无论如何都会先将 namespace 的 phase 先置为 terminating。这也就是说,如果一个 namespace 已经处于 terminating 了,你就无法通过仅仅修改该 phase 来改变该 namespace 的状态。我之前在遇到过 namespace 一直处于 terminating 时,手动修改了 phase 为 active,但是 namespace 会立刻变为 terminating,原因大概就是如此了。

// updateNamespaceStatusFunc will verify that the status of the namespace is correct
func (d *namespacedResourcesDeleter) updateNamespaceStatusFunc(namespace *v1.Namespace) (*v1.Namespace, error) {
    if namespace.DeletionTimestamp.IsZero() || namespace.Status.Phase == v1.NamespaceTerminating {
        return namespace, nil
    }
    newNamespace := v1.Namespace{}
    newNamespace.ObjectMeta = namespace.ObjectMeta
    newNamespace.Status = *namespace.Status.DeepCopy()
    newNamespace.Status.Phase = v1.NamespaceTerminating
    return d.nsClient.UpdateStatus(context.TODO(), &newNamespace, metav1.UpdateOptions{})
}

之后就开始尝试清空该 namespace 下的所有内容:

    // there may still be content for us to remove
    estimate, err := d.deleteAllContent(namespace)
    if err != nil {
        return err
    }
    if estimate > 0 {
        return &ResourcesRemainingError{estimate}
    }

四、DiscoveryInterface 的工作机制

现在我们面临的一个问题就是如何清理该 namespace 下的所有资源呢?平时如果我们要删除一个 pod,我们可以调用 client-go 提供的 PodInterface 接口来删除,其实就是 RESTful 的 HTTP DELETE 动作的封装。但是现在因为我们不知道 namespace 下有哪些资源,所以就没有办法直接调用删除的接口。

所以 client-go 还提供了一个 DiscoveryInterface,顾名思义,DicoveryInterface 可以用来发现集群中的 API groups,versions, resources。在取得集群中所有的接口资源列表口,我们就可以对这些资源进行查询和删除了。DicoveryInterface 接口如下:

// DiscoveryInterface holds the methods that discover server-supported API groups,
// versions and resources.
type DiscoveryInterface interface {
    RESTClient() restclient.Interface
    ServerGroupsInterface
    ServerResourcesInterface
    ServerVersionInterface
    OpenAPISchemaInterface
}

其中 ServerGroupInterface 提供了获取集群中所有接口组的能力,具体的函数签名如下:

    // ServerGroups returns the supported groups, with information like supported versions and the
    // preferred version.
    ServerGroups() (*metav1.APIGroupList, error)

ServerVersionInterface 可以用来获取服务的版本信息,具体的函数签名如下:

    // ServerVersion retrieves and parses the server's version (git version).
    ServerVersion() (*version.Info, error)

然后我们需要关注的是 ServerResourcesInterface 这个接口

// ServerResourcesInterface has methods for obtaining supported resources on the API server
type ServerResourcesInterface interface {
    // ServerResourcesForGroupVersion returns the supported resources for a group and version.
    ServerResourcesForGroupVersion(groupVersion string) (*metav1.APIResourceList, error)
    // ServerResources returns the supported resources for all groups and versions.
    //
    // The returned resource list might be non-nil with partial results even in the case of
    // non-nil error.
    //
    // Deprecated: use ServerGroupsAndResources instead.
    ServerResources() ([]*metav1.APIResourceList, error)
    // ServerResources returns the supported groups and resources for all groups and versions.
    //
    // The returned group and resource lists might be non-nil with partial results even in the
    // case of non-nil error.
    ServerGroupsAndResources() ([]*metav1.APIGroup, []*metav1.APIResourceList, error)
    // ServerPreferredResources returns the supported resources with the version preferred by the
    // server.
    //
    // The returned group and resource lists might be non-nil with partial results even in the
    // case of non-nil error.
    ServerPreferredResources() ([]*metav1.APIResourceList, error)
    // ServerPreferredNamespacedResources returns the supported namespaced resources with the
    // version preferred by the server.
    //
    // The returned resource list might be non-nil with partial results even in the case of
    // non-nil error.
    ServerPreferredNamespacedResources() ([]*metav1.APIResourceList, error)
}

这里我们可以用 ServerPreferredNamespacedResources 来获取所有属于 namespace 的资源列表。然后过滤出支持 DELETE 的资源。最后获取这些资源的 GroupVersionResources(简称 GVR )。

    resources, err := d.discoverResourcesFn()
    if err != nil {
        // discovery errors are not fatal.  We often have some set of resources we can operate against even if we don't have a complete list
        errs = append(errs, err)
        conditionUpdater.ProcessDiscoverResourcesErr(err)
    }
    // TODO(sttts): get rid of opCache and pass the verbs (especially "deletecollection") down into the deleter
    deletableResources := discovery.FilteredBy(discovery.SupportsAllVerbs{Verbs: []string{"delete"}}, resources)
    groupVersionResources, err := discovery.GroupVersionResources(deletableResources)
    if err != nil {
        // discovery errors are not fatal.  We often have some set of resources we can operate against even if we don't have a complete list
        errs = append(errs, err)
        conditionUpdater.ProcessGroupVersionErr(err)
    }

最后遍历这些 GVR 进行删除:

    for gvr := range groupVersionResources {
        gvrDeletionMetadata, err := d.deleteAllContentForGroupVersionResource(gvr, namespace, namespaceDeletedAt)
    }

五、为什么 namespace 会长时间处于 terminating 状态

要探究 namespace 长时间处于 terminating 状态的原因,我们先看下面一段很短的代码:

    // there may still be content for us to remove
    estimate, err := d.deleteAllContent(namespace)
    if err != nil {
        return err
    }
    if estimate > 0 {
        return &ResourcesRemainingError{estimate}
    }

在删除命名空间下所有资源的时候,如果返回了错误,或者预估删除完所有资源的时间大于 0 的话,就会继续处于 terminating 状态。比如说 pod 会有一个 terminationGracePeriodSeconds,那么在删除 pod 的时候就可能要等待这个周期过去。但是这也造成不了什么问题,我们常常遇到的头疼问题是,namespace 一直无法删除。简单来说,就是 namespace 下肯定还有资源没法删除,可能性有以下几种。

部分资源有 admission 阻止了删除,因为所有的删除请求都要先进过 admission webhook,那么可能因为 admission 的原因导致部分资源无法直接删除。

apiservice 出问题了。这个问题我们可以通过 kubectl get apiservice 来确认,在 AVAILABLE 一列中,如果有 false 的话,我们就要去检查这个 apiservice 无法使用的原因了。因为 apiservice 出了问题,就会导致这个 apiservice 下的资源无法通过 HTTP 请求去查询或操作,那么自然无法确认是否还有这部分资源遗留,也就无法彻底删除了。

最后,关于 namespace 无法删除的解决方案,网上给出的方案往往是通过置空 namespace 的 spec.finalizers 来做,但是这是治标不治本的方法。因为如果 namespace 无法删除,就一定说明你的集群中存在缺陷或问题,还是要找出真正的原因才是解决之道。你也可以尝试这个工具找出问题所在:https://github.com/thyarles/knsk

informer 的基础知识

简介

informer 是 client-go 提供的一个工具,主要是用来在 api-server 和程序之间同步指定的资源,并作为本地缓存,比如 Pod, Deployment 等等。

我们都知道,kubernetes 中有很多个 controller 在运行,来保证它们关注的资源处于符合期望的状态。比如 ReplicasSet,会保证该 ReplicaSet 有期望的副本数一直运行。这是通过一个不会终止的循环,不断监控当前集群的状态,然后调整的期望的状态。如下代码所示:

for {
    current := getCurrentState()
    desired := getDesiredState()
    reconcile(current, desired)
}

因为这样的需求,所以 controller 需要不停的获取集群中一些资源的状态,然后调整到期望的状态。如果我们是通过网络不停的查询集群状态,将是一个性能很差的方案。为了性能,可以使用缓存,来将指定的资源保存在本地,只要我们及时的更新缓存,就不需要通过网络向集群查询了。

这就是 informer 出现的原因。它通过 List&Watch 来实时同步 api-server 中的资源,然后将资源分成三种事件来触发不同的处理。这三种事件是: Add, UpdateDelete。同时它还提供了一个抽象的 Store 来提供本地缓存的查询。

最后,它还可以配合 workqueue 来实现本地的重试等等。informer 是一个非常强大的工具,在我们做 kubernetes 上 controller 的开发时必不可少,但是因为 controller 的编写本身就是一件比较复杂的工作,我们必须要对 informer 本身,以及其周边的工具有清晰的理解,才能写出质量更好的代码。

工作流程

informer

这里先放上一张图来做参考。一般我们在使用 informer 时,会使用如下的代码:

// filterd
lw := cache.ListWatch{
    ListFunc: func(options metav1.ListOptions) (object runtime.Object, err error) {
        return k8sCli.CoreV1().Pods(metav1.NamespaceAll).List(context.TODO(), options)
    },
    WatchFunc: func(options metav1.ListOptions) (w watch.Interface, err error) {
        return k8sCli.CoreV1().Pods(metav1.NamespaceAll).Watch(context.TODO(), options)
    },
}
// indexerInformer, shareInformer
store, ctrl := cache.NewInformer(&lw, &v1.Pod{}, 0, cache.ResourceEventHandlerFuncs{
    AddFunc:    handleAddPod,
    UpdateFunc: handleUpdatePod,
    DeleteFunc: handleDeletePod,
})
stopChan := signals.SetupSignalHandler()
go ctrl.Run(stopChan)
if sync := cache.WaitForCacheSync(stopChan, ctrl.HasSynced); !sync {
    log.Println("not sync")
}
log.Println("synchronized finish")

首先,我们定义了 ListWatch 的方法,informer 会用 List 方法来获取所有的 Pod 资源,然后使用 Watch 来监听之后 Pod 资源的更新。

之后我们实例化了一个 informer。第二个参数是资源类型。第三个参数是重新同步的周期,0为不同步,否则会在每个周期开始时重新 List 所有的资源。第四个参数是 ResourceEventHandlerFuncs,这里的 AddFunc, UpdateFunc,DeleteFunc 是本地缓存在增加,更新和删除时触发的事件。

NewInformer 返回了 store 和 ctrl 两个值,store 就是 pod 的本地缓存,我们可以通过查询 store 来代替直接向 api-server 查询。这个返回的 store 实现了如下的接口:

type Store interface {
    Add(obj interface{}) error
    Update(obj interface{}) error
    Delete(obj interface{}) error
    List() []interface{}
    ListKeys() []string
    Get(obj interface{}) (item interface{}, exists bool, err error)
    GetByKey(key string) (item interface{}, exists bool, err error)

    // Replace will delete the contents of the store, using instead the
    // given list. Store takes ownership of the list, you should not reference
    // it after calling this function.
    Replace([]interface{}, string) error
    Resync() error
}

在 controller 中,我们一般使用 List*, Get* 方法,可以用来查询本地的缓存。同时不要使用其他的方法,这会导致一些不可预知的问题。

另外一个返回值 ctrl,实现了如下的接口:

type Controller interface {
    Run(stopCh <-chan struct{})
    HasSynced() bool
    LastSyncResourceVersion() string
}

这个接口很简单,Run 用来开始启动同步,stopCh 用来随时停止同步,HasSynced 用来判断同步是否完成。LastSyncResourceVersion 用来获取最新同步的资源 version。

cache.WaitForCacheSync 用来等待同步完成。

总结

关于 informer 的基本使用就先介绍这么多。后面会对 informer 中涉及的代码进行详细的分析,包括 List&Watch 的机制、DeltaFIFO 的实现、本地缓存(Store) 的实现等等。

从 iptables 看 k8s service 的实现机制

概述

k8s service 可以看做是多个 Pod 的负载均衡。有以下几种 service:

  • LoadBalancer
  • ClusterIP
  • NodePort
  • ExternalName

在 service 的演进中,从最初的 userspace 的方案变成 iptables 和 ipvs 的方案,其中,ipvs 主要是解决了 iptables 的性能问题。这篇文章主要分析 iptables 如何实现 service 的负载均衡。

ClusterIP

ClusterIP 是提供在集群中访问 Service 的方案,通常每个 Service 都会分配一个 VIP,然后为多个 Pod 提供负载均衡。这里我们创建两个副本的 nginx 部署,以及一个 nginx service。具体信息如下:

$ kubectl get endpoints nginx
NAME    ENDPOINTS                     AGE
nginx   172.17.0.4:80,172.17.0.5:80   65m

$ kubectl get service nginx
NAME    TYPE        CLUSTER-IP      EXTERNAL-IP   PORT(S)   AGE
nginx   ClusterIP   10.111.67.225   <none>        80/TCP    65m

在集群中访问 nginx.default.svc.cluster.local 时,DNS 会将这个地址解析到 Service 的 IP 上,也就是 10.111.67.225。下面我们看看 iptables 是如何将访问这个地址的流量转到真实的 Pod 上的。

首先看一下 nat 表上的 OUTPUT 链:

$ iptables -t nat -nL OUTPUT
Chain OUTPUT (policy ACCEPT)
target     prot opt source               destination
KUBE-SERVICES  all  --  0.0.0.0/0            0.0.0.0/0            /* kubernetes service portals */
DOCKER     all  --  0.0.0.0/0           !127.0.0.0/8          ADDRTYPE match dst-type LOCAL

第一条规则会匹配所有的流量,然后跳到 KUBE-SERVICES 这条链上。我们看一下 KUBE-SERVICES 的具体内容:

$ iptables -t nat -nL KUBE-SERVICES
Chain KUBE-SERVICES (2 references)
target     prot opt source               destination
KUBE-SVC-NPX46M4PTMTKRN6Y  tcp  --  0.0.0.0/0            10.96.0.1            /* default/kubernetes:https cluster IP */ tcp dpt:443
KUBE-SVC-P4Q3KNUAWJVP4ILH  tcp  --  0.0.0.0/0            10.111.67.225        /* default/nginx:http cluster IP */ tcp dpt:80
KUBE-SVC-TCOU7JCQXEZGVUNU  udp  --  0.0.0.0/0            10.96.0.10           /* kube-system/kube-dns:dns cluster IP */ udp dpt:53
KUBE-SVC-ERIFXISQEP7F7OF4  tcp  --  0.0.0.0/0            10.96.0.10           /* kube-system/kube-dns:dns-tcp cluster IP */ tcp dpt:53
KUBE-SVC-JD5MR3NA4I4DYORP  tcp  --  0.0.0.0/0            10.96.0.10           /* kube-system/kube-dns:metrics cluster IP */ tcp dpt:9153
KUBE-NODEPORTS  all  --  0.0.0.0/0            0.0.0.0/0            /* kubernetes service nodeports; NOTE: this must be the last rule in this chain */ ADDRTYPE match dst-type LOCAL

这里前面的 KUBE-SVC-* 都是根据 destination, protocol 和目的端口号来匹配的,根据我们的 service 地址和端口号以及协议,可以定位到 KUBE-SVC-P4Q3KNUAWJVP4ILH 这条规则可以匹配,然后跳到这条链上。我们接着看这条链定义了什么:

$ iptables -t nat -nL KUBE-SVC-P4Q3KNUAWJVP4ILH
Chain KUBE-SVC-P4Q3KNUAWJVP4ILH (1 references)
target     prot opt source               destination
KUBE-SEP-GL7IUDQTUTXSADHR  all  --  0.0.0.0/0            0.0.0.0/0            /* default/nginx:http */ statistic mode random probability 0.50000000000
KUBE-SEP-VMO3WCKZND6ZICDD  all  --  0.0.0.0/0            0.0.0.0/0            /* default/nginx:http */

有两条规则,根据第一条规则后面的内容,我们可以知道这就是使用 iptables 实现负载均衡的地方了。第一条规则有 50% 的匹配几率。如果匹配到了其中一条,就会跳到另外一个链上。比如:

$ iptables -t nat -nL KUBE-SEP-GL7IUDQTUTXSADHR
Chain KUBE-SEP-GL7IUDQTUTXSADHR (1 references)
target     prot opt source               destination
KUBE-MARK-MASQ  all  --  172.17.0.4           0.0.0.0/0            /* default/nginx:http */
DNAT       tcp  --  0.0.0.0/0            0.0.0.0/0            /* default/nginx:http */ tcp to:172.17.0.4:80

其中第一条规则的 source 是 Pod 的 IP,在访问 Service 时目前还不会匹配,于是我们看第二条规则,将目的 IP 和 Port 改写成 172.17.0.4:80,也就是我们的 Pod IP,这样流量就经过负载均衡指向了我们的 Pod了。

NodePort

我们将上面的 Service 改成 NodePort

nginx        NodePort    10.111.67.225   <none>        80:30000/TCP   34h

然后查询机器上的 30000 端口。

$ ss -lp | grep 30000
tcp               LISTEN              0                    0                                                                                            0.0.0.0:30000                                                 0.0.0.0:*                  users:(("kube-proxy",pid=4006,fd=8))

可以看到, kube-proxy 监听了 30000 端口,同时我们看 nat 表上的 PREROUTING 链。

KUBE-SERVICES  all  --  0.0.0.0/0            0.0.0.0/0            /* kubernetes service portals */

再看 KUBE-SERVICES

KUBE-SVC-TCOU7JCQXEZGVUNU  udp  --  0.0.0.0/0            10.96.0.10           /* kube-system/kube-dns:dns cluster IP */ udp dpt:53
KUBE-SVC-ERIFXISQEP7F7OF4  tcp  --  0.0.0.0/0            10.96.0.10           /* kube-system/kube-dns:dns-tcp cluster IP */ tcp dpt:53
KUBE-SVC-JD5MR3NA4I4DYORP  tcp  --  0.0.0.0/0            10.96.0.10           /* kube-system/kube-dns:metrics cluster IP */ tcp dpt:9153
KUBE-SVC-NPX46M4PTMTKRN6Y  tcp  --  0.0.0.0/0            10.96.0.1            /* default/kubernetes:https cluster IP */ tcp dpt:443
KUBE-SVC-P4Q3KNUAWJVP4ILH  tcp  --  0.0.0.0/0            10.111.67.225        /* default/nginx:http cluster IP */ tcp dpt:80
KUBE-NODEPORTS  all  --  0.0.0.0/0            0.0.0.0/0            /* kubernetes service nodeports; NOTE: this must be the last rule in this chain */ ADDRTYPE match dst-type LOCAL

最后一条 KUBE-NODEPORTS 可以匹配到,这里有个匹配条件,那就是 ADDRTYPE match dst-type LOCAL。注意这里的 LOCAL 指的是本机网卡上存在的地址,也就是这条数据是发到本机,那么就能匹配。

KUBE-NODEPORTS 的规则如下:

KUBE-MARK-MASQ  tcp  --  0.0.0.0/0            0.0.0.0/0            /* default/nginx:http */ tcp dpt:30000
KUBE-SVC-P4Q3KNUAWJVP4ILH  tcp  --  0.0.0.0/0            0.0.0.0/0            /* default/nginx:http */ tcp dpt:30000

第一条规则是替换源地址为本机出口的网卡地址。第二条规则如下:

KUBE-SEP-F3MS6OIYSABTYGOY  all  --  0.0.0.0/0            0.0.0.0/0            /* default/nginx:http */ statistic mode random probability 0.50000000000
KUBE-SEP-VMO3WCKZND6ZICDD  all  --  0.0.0.0/0            0.0.0.0/0            /* default/nginx:http */

这里我们在 ClusterIP 中就分析了实现方法,因此这里忽略。

LoadBalancer

LoadBalancer 本身不是由 Kubernetes 提供的,其原理说起来也不难,我们先创建一个 LoadBalancer 的 Service 看看:

nginx        LoadBalancer   10.111.67.225   <pending>     80:32014/TCP   34h

这里因为我的本地集群没有 LoadBalancer,所以一直处于 Pending 状态。但是我们可以看到,这里还有一个 80:32014。和上面的 NodePort 输出一致。也就是说创建 LoadBalancer 时,会在 Pod 所在的机器上开启 NodePort,然后由外部的 LoadBalancer 将负载均衡过的流量带到机器的指定的 NodePort 上。

一些有意思的参数

这里顺便多提几个有意思的Service 参数

externalTrafficPolicy:可选值有 LocalCluster

  • Local: 流量只会被导向本机的 Pod,这样就少一次包的转发,提高性能。但是缺点是如果容易导致负载不均衡。
  • Cluster: 在集群范围内转发流量

如果能保证 Pod 均匀的分布在不同的节点上,那么外部的 LoadBalancer 配合 Local 的 externalTrafficPolicy 可以带来更好的性能。

sessionAffinity: 会话亲和性,可以设置为 ClientIP,来达到将同一个 IP 的会话转发到相同的 Pod 上。其也是通过 iptables 实现的。

KUBE-SEP-Q7ZFI57LOFFPF3HN  all  --  0.0.0.0/0            0.0.0.0/0            /* test/nginx-session-affinity:http */ recent: CHECK seconds: 10800 reap name: KUBE-SEP-Q7ZFI57LOFFPF3HN side: source mask: 255.255.255.255
KUBE-SEP-LWUZWBNY6M3CYJ2M  all  --  0.0.0.0/0            0.0.0.0/0            /* test/nginx-session-affinity:http */ recent: CHECK seconds: 10800 reap name: KUBE-SEP-LWUZWBNY6M3CYJ2M side: source mask: 255.255.255.255
KUBE-SEP-Q7ZFI57LOFFPF3HN  all  --  0.0.0.0/0            0.0.0.0/0            /* test/nginx-session-affinity:http */ statistic mode random probability 0.50000000000
KUBE-SEP-LWUZWBNY6M3CYJ2M  all  --  0.0.0.0/0            0.0.0.0/0            /* test/nginx-session-affinity:http */

这个 iptables 的前两条规则就是在做 iptables 的检查。

kubernetes 的 taints 和 tolerations 的理解和实践

概述

taints 和 tolerations 是一个比较好理解的概念,taints 可以翻译为污点,给 node 打上 taints,就可以用来驱逐 pod,并防止 pod 调度到该节点上。就像是某个人有了一个坏习惯(taints),那么其他人的就会远离这个人。但是有些人可以容忍别人的坏习惯,那么就会不受影响。就像 pod 拥有了 tolerations,就可以免疫节点上对应的 taints。

taints 的官方说明为:

The node this Taint is attached to has the “effect” on any pod that does not tolerate the Taint.

也就是说,taint 会为所有不能忍受该 taint 的 pod 添加副作用(不调度,偏好不调度,不执行)

如果要让某些 pod 免疫这些 taints,可以使用 tolerations。

taints 的使用

在使用 taints 的时候很简单,我们只需要指定节点 taints 的 key 和 value 即可。比如:

$ kubectl taint nodes minikube onlyNginxPod=true:NoSchedule

其中,onlyNginxPod 是 taints 的 key,true 是 value,NoSchedule 是 effect。另外还有 PreferNoScheduler 和 NoExecute。这里顺便总结一下这三种 effect 的区别:

  • NoSchedule: 表示不要将 Pod 向该节点调度。如果 Pod 已经调度到该节点了,则不受影响。
  • PreferNoScheduler: 表示尽量不要往该节点调度,但是如果没有其他选择,还是会将 Pod 调度到该节点。
  • NoExecute: Pod 不仅不能往上调度,所有已经运行在该节点上的 Pod 将会被驱逐。

这个时候,我们尝试创建一个普通的 pod,看看调度情况。

pod.yaml

apiVersion: v1
kind: Pod
metadata:
    name: nginx
    namespace: default
    labels:
        app: nginx
spec:
    containers:
    - name: nginx
      image: nginx:latest
$ kubectl apply -f pod-nginx.yaml 
$ kubectl describe pods nginx

Warning  FailedScheduling  <unknown>  default-scheduler  0/1 nodes are available: 1 node(s) had taint {onlyNginxPod: true}, that the pod didn't tolerate.

会出现上面的警告信息。表示因为 pod 没有容忍该 taint,所以没有办法调度上去。

我们可以用以下语句来删除 taint

$ kubectl taint node minikube onlyNginxPod=true:NoSchedule-

tolerations 的使用

某些情况下,我们仍然希望 Pod 可以调度到有 taint 的节点上,这时候就可以为 Pod 指定 tolerations。比如将上面的 Pod 改写成如下:

pod.yaml

apiVersion: v1
kind: Pod
metadata:
    name: nginx
    namespace: default
    labels:
        app: nginx
spec:
    containers:
    - name: nginx
      image: nginx:latest
    tolerations:
      - key: onlyNginxPod
        operator: Equal
        value: "true"
        effect: NoSchedule

然后创建这个 Pod,

···yaml
kubectl apply -f pod.yaml kubectl get pods
NAME READY STATUS RESTARTS AGE
nginx 0/1 ContainerCreating 0 4s
···

说明该 pod 调度成功,tolerations 生效了。tolerations 会匹配 key 和 effect,只有一样的时候才会生效。tolerations 的 operator 字段除了 Equal 之外,还有 Exists

  • Equal: 要求 value 也相同。
  • Exists: 不需要设置 value 字段。

kubernetes 中使用 taints 和 tolerations 的常用场景

taints 和 tolerations 不仅仅是提供给用户使用的特性,kubernetes 本身也大量使用了 taints 和 tolerations。比如:

  • node.kubernetes.io/not-ready: Node 还没准备好,对应的 NodeCondition 的 ReadyFalse。比如在创建集群时,还没有安装 CNI 的话,节点就会有该 taint。对应的 effect 为 NoSchedule。

  • node.kubernetes.io/unreachable: node controller 无法连接到 Node,此时 NodeCondition 的 ReadyUnknown。对应的 effect 为 NoSchedule。

  • node.kubernetes.io/out-of-disk: 磁盘用尽。对应的 effect 为 NoSchedule。

  • node.kubernetes.io/memory-pressure: 节点有内存的压力。对应的 effect 为 NoSchedule。

  • node.kubernetes.io/disk-pressure: 节点有磁盘压力。和四个参数有关:nodefs.available, nodefs.inodesFree, imagefs.available, imagefs.inodesFree。nodefs 是用来存储卷和 daemon 日志的,imagefs 是容器运行时用来存储镜像和容器可写层的。当这些值到达某个阈值,就会出现 disk-pressure。对应的 effect 为 NoSchedule。

  • node.kubernetes.io/network-unavailable: 节点的网络还不可用。对应的 effect 为 NoSchedule。

  • node.kubernetes.io/unschedulable: 节点是不可调度的。对应的 effect 为 NoSchedule。

  • node.kubernetes.io/pid-pressure: 节点上的进程太多。对应的 effect 为 NoSchedule。

[Gaia Scheduler] gpu-manager 的虚拟化 gpu 分配流程

概述

在之前的一篇文章主要是分析了 gpu-manager 的启动流程。关于 gpu-manager 应该会有一系列的文章,一是觉得这是一个很有价值的项目,二是为这个项目花了好几天去看代码,想通过写文章的方式对内容进行梳理。

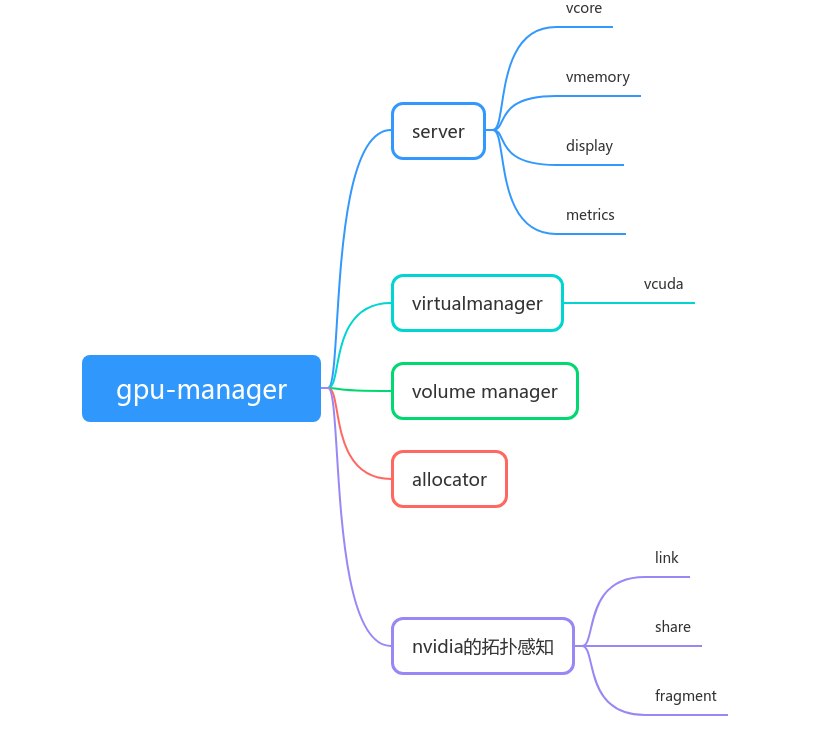
这篇文章主要分析 gpu-manager 的虚拟 gpu 分配原理,我认为将虚拟 gpu 分配给容器主要有两个重点:

  • gpu-manager 作为 device plugin 的工作流程
  • 虚拟 gpu 分配的最优方案,分配需要保证最少碎片,同时性能最好

从 pod 调度到虚拟 gpu 分配

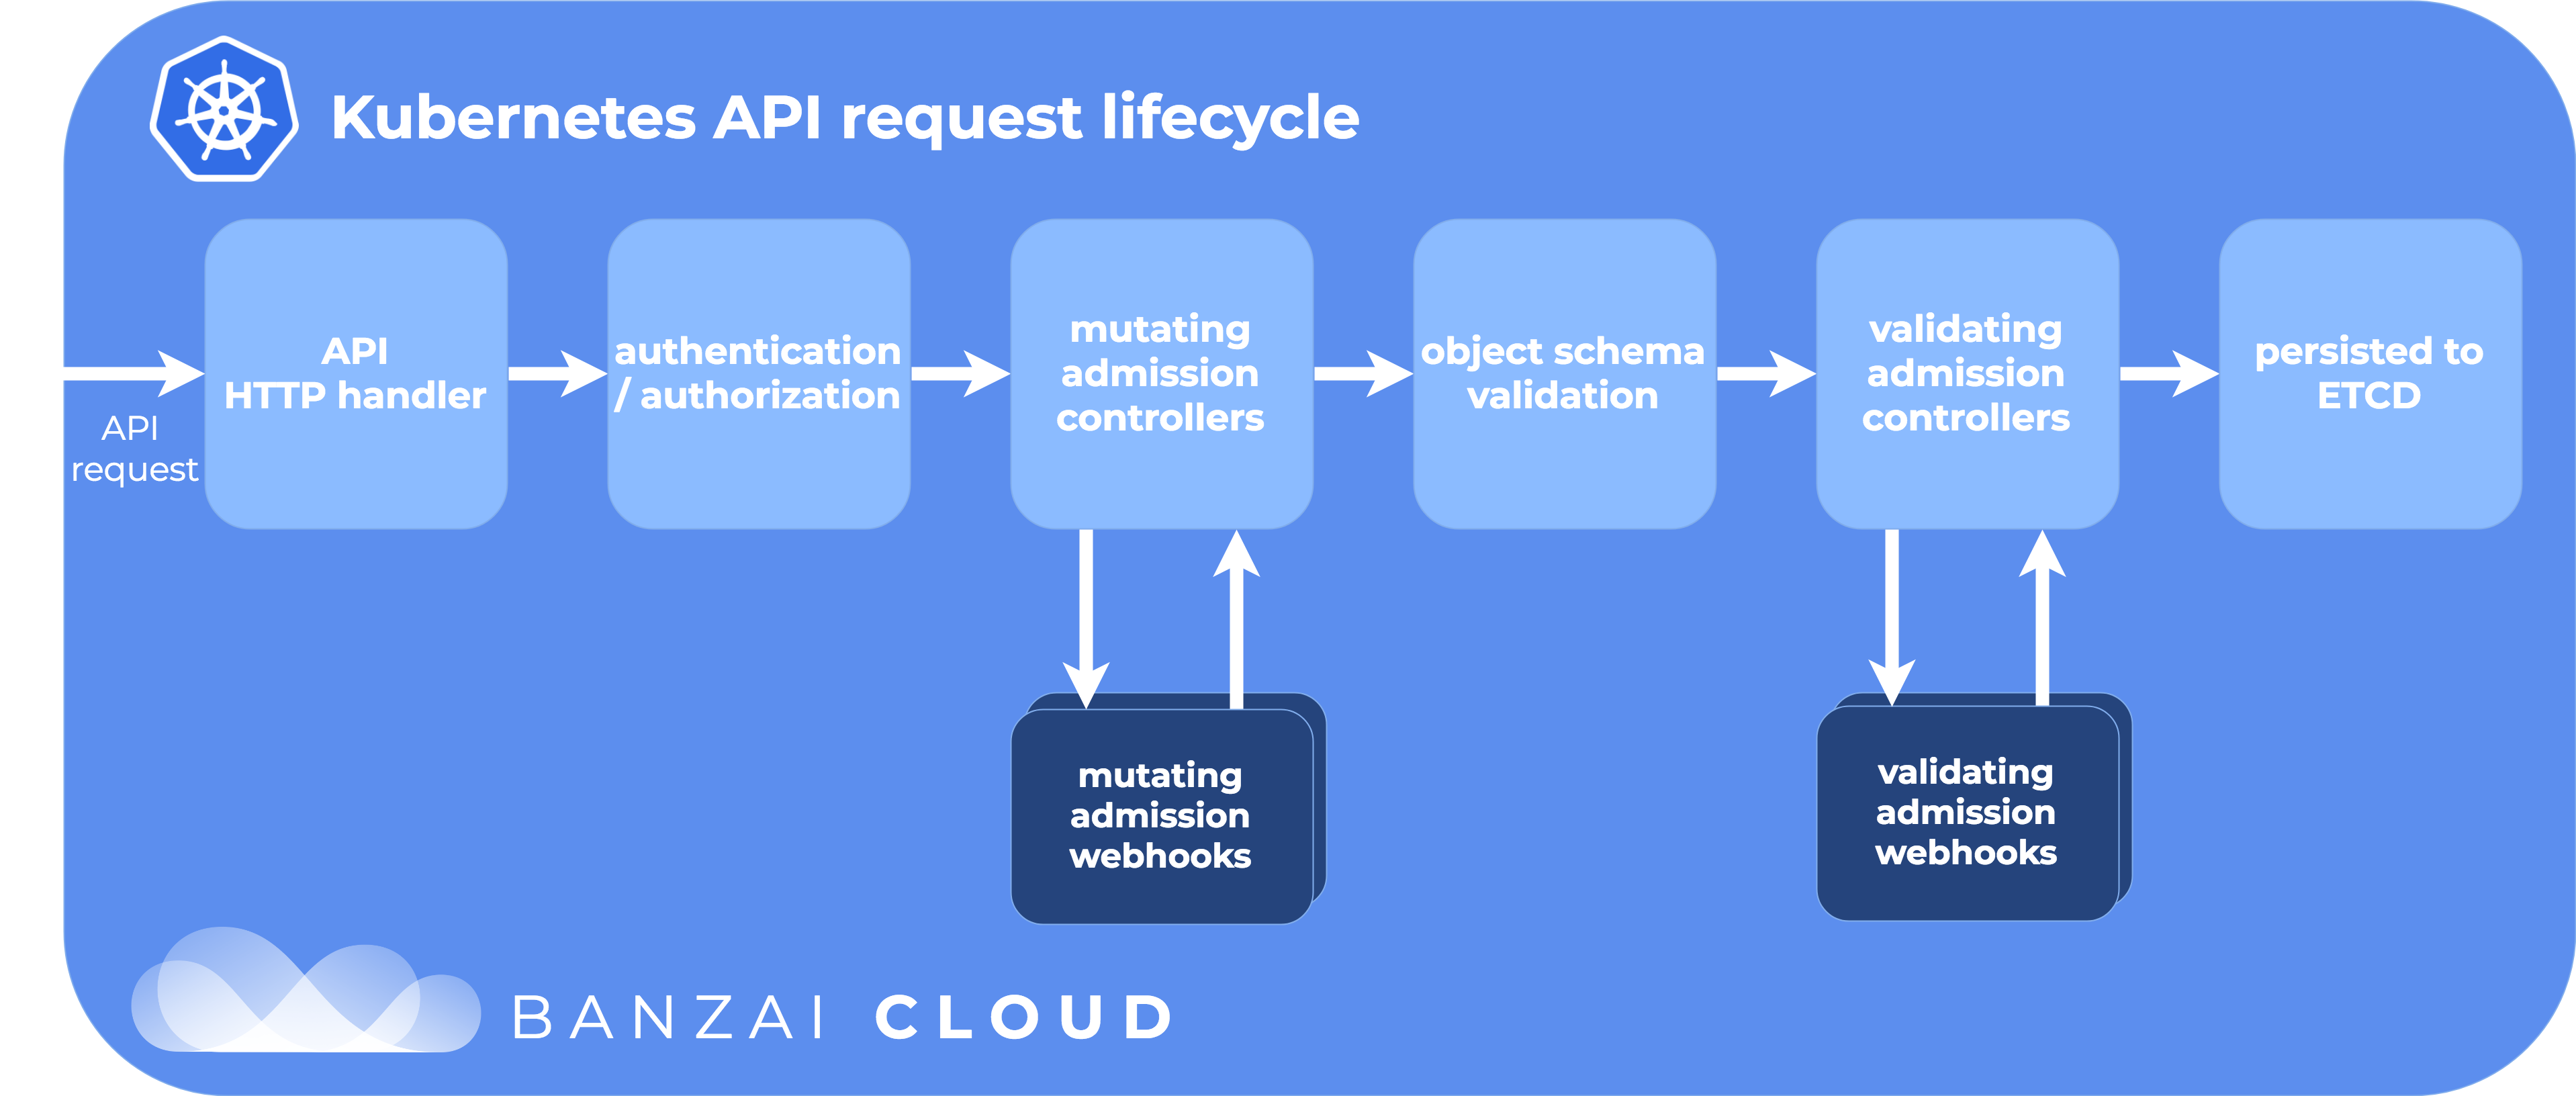
这一部分会涉及到 device plugin 的工作机制,因此不熟悉的话可以看一下之前的一篇文章:Kubernetes开发知识–device-plugin的实现。下面附上一张这篇文章中 device plugin 的工作时序图:

device plugin

在之前的启动流程分析文章中,说到 gpu-manager 向 kubelet 注册。在这之后, gpu-manager 就正式作为一个 device plugin 来工作了。这个时候,我们可以创建如下的 pod:

apiVersion: v1
kind: Pod
metadata:
  name: tf-training-example-10
  namespace: test
  labels:
    name: tf-training-example
spec:
  restartPolicy: Never
  containers:
  - name: tf-training-example
    image: joyme/tf_training_example:1.5
    resources:
      requests:
        tencent.com/vcuda-core: 20
        tencent.com/vcuda-memory: 15
      limits:
        tencent.com/vcuda-core: 20
        tencent.com/vcuda-memory: 15

这个创建 pod 的请求会到达 kubernetes 的 API Server,然后由 kube-scheduler 进行调度。kube-scheduler 的调度经过预选和优选两个阶段,确定了最佳的目标节点。这时候 kubelet 就上场了。因为我们的 pod 中的容器请求了 vcuda-corevcuda-memory 这两个资源,但是 kubelet 并没有能力去给容器分配这些资源,于是它就找是谁注册了这些资源类型,然后发现是 vcore 和 vmemory 这两个服务注册的,于是使用 grpc 和 /var/lib/kubelet/device-plugins/vcore.sock 以及 /var/lib/kubelet/device-plugins/vmemory.sock 通过 unix socket 通讯。

vcore 和 vmemory 是两种资源,因此这里其实相当于注册了两个 device plugin。

对于 vcuda-memory,kubelet 调用的 Allocate 方法如下:

/** device plugin interface */
func (vr *vmemoryResourceServer) Allocate(ctx context.Context, reqs *pluginapi.AllocateRequest) (*pluginapi.AllocateResponse, error) {
    glog.V(2).Infof("%+v allocation request for vmemory", reqs)
    fakeData := make([]*pluginapi.ContainerAllocateResponse, 0)
    fakeData = append(fakeData, &pluginapi.ContainerAllocateResponse{})

    return &pluginapi.AllocateResponse{
        ContainerResponses: fakeData,
    }, nil
}

这里其实并没有做任何实际分配操作,我们可以认为 vcuda-core 和 vcuda-memory 必然是同时申请分配的,因此我们只需要处理二者之一即可。

对于 vcuda-core,kubelet 会调用的 Allocate 方法代码如下:

func (vr *vcoreResourceServer) Allocate(ctx context.Context, reqs *pluginapi.AllocateRequest) (*pluginapi.AllocateResponse, error) {
    glog.V(2).Infof("%+v allocation request for vcore", reqs)
    return vr.mgr.Allocate(ctx, reqs)
}

最终会走到 pkg/services/allocator/nvidia/allocator.go 的 Allcate 方法中。下面就来到这篇文章最复杂的部分了。

func (ta *NvidiaTopoAllocator) Allocate(_ context.Context, reqs *pluginapi.AllocateRequest) (*pluginapi.AllocateResponse, error) {
}

我们先看一下函数原型,reqs *pluginapi.AllocateRequest 这个参数是分配请求,然后返回了一个分配响应 *pluginapi.AllocateResponse。这里看一下 AllocateRequest:

// - Allocate is expected to be called during pod creation since allocation
//   failures for any container would result in pod startup failure.
// - Allocate allows kubelet to exposes additional artifacts in a pod's
//   environment as directed by the plugin.
// - Allocate allows Device Plugin to run device specific operations on
//   the Devices requested
type AllocateRequest struct {
    ContainerRequests []*ContainerAllocateRequest `protobuf:"bytes,1,rep,name=container_requests,json=containerRequests" json:"container_requests,omitempty"`
}

type ContainerAllocateRequest struct {
    DevicesIDs []string `protobuf:"bytes,1,rep,name=devicesIDs" json:"devicesIDs,omitempty"`
}

很明显,请求里包含了每个容器需要的设备数组。同时通过 AllocateRequest 上的注释可以得出以下信息:

  • Allocate 是在 pod 创建时被调用的,因此任何容器分配失败都会造成pod启动失败。
  • Allocate 允许 kubelet 在 pod 环境中引入更多的 artifacts,这部分工作由我们的 device plugin 主导。对于 gpu manager 来说就是,覆盖容器内的 LD_LIBRARY_PATH,挂载 cuda 库文件等等。
  • Allocate 允许 device plugin 在设备上运行特定的操作。

然后再来看一下 AllocateResponse:

// AllocateResponse includes the artifacts that needs to be injected into
// a container for accessing 'deviceIDs' that were mentioned as part of
// 'AllocateRequest'.
// Failure Handling:
// if Kubelet sends an allocation request for dev1 and dev2.
// Allocation on dev1 succeeds but allocation on dev2 fails.
// The Device plugin should send a ListAndWatch update and fail the
// Allocation request
type AllocateResponse struct {
    ContainerResponses []*ContainerAllocateResponse `protobuf:"bytes,1,rep,name=container_responses,json=containerResponses" json:"container_responses,omitempty"`
}

type ContainerAllocateResponse struct {
    // List of environment variable to be set in the container to access one of more devices.
    Envs map[string]string `protobuf:"bytes,1,rep,name=envs" json:"envs,omitempty" protobuf_key:"bytes,1,opt,name=key,proto3" protobuf_val:"bytes,2,opt,name=value,proto3"`
    // Mounts for the container.
    Mounts []*Mount `protobuf:"bytes,2,rep,name=mounts" json:"mounts,omitempty"`
    // Devices for the container.
    Devices []*DeviceSpec `protobuf:"bytes,3,rep,name=devices" json:"devices,omitempty"`
    // Container annotations to pass to the container runtime
    Annotations map[string]string `protobuf:"bytes,4,rep,name=annotations" json:"annotations,omitempty" protobuf_key:"bytes,1,opt,name=key,proto3" protobuf_val:"bytes,2,opt,name=value,proto3"`
}

这里我们又可以看到一些关键信息,AllocateResponse 为每个容器返回了 ContainerAllocateResponse,包括容器的环境变量,容器的挂载,容器的设备信息,容器的 annotations 信息。其中,容器的设备信息如下:

// DeviceSpec specifies a host device to mount into a container.
type DeviceSpec struct {
    // Path of the device within the container.
    ContainerPath string `protobuf:"bytes,1,opt,name=container_path,json=containerPath,proto3" json:"container_path,omitempty"`
    // Path of the device on the host.
    HostPath string `protobuf:"bytes,2,opt,name=host_path,json=hostPath,proto3" json:"host_path,omitempty"`
    // Cgroups permissions of the device, candidates are one or more of
    // * r - allows container to read from the specified device.
    // * w - allows container to write to the specified device.
    // * m - allows container to create device files that do not yet exist.
    Permissions string `protobuf:"bytes,3,opt,name=permissions,proto3" json:"permissions,omitempty"`
}

即在容器中挂载设备需要:

  • 设备相对于容器的地址
  • 设备在宿主机上的地址
  • 设备的 Cgroups 信息

这时候我们再来重新思考 gpu-manager 的 gpu 虚拟化原理。如果你看过腾讯关于 Gaia Scheduler 的论文,就会知道 gpu-manager 需要做以下工作:

  • 为容器挂载 cuda 相关的库,包括 vcuda-control 这个项目的拦截库
  • 通过覆盖容器中的 LD_LIBRARY_PATH 来将 cuda 调用指向 libcuda-control.so 这个库,这个库里面对显存和计算 api 做了拦截。
  • 为容器挂载 vcuda.sock,在容器调用特定的 cuda api 时,会触发 grpc 调用,通过 vcuda.sock 和 virtual manager 通信,virtual manager 下发容器配置。这样拦截库就知道自己应该怎么限制容器了。这里留一个问题 A,为什么要大费周章的通过 grpc,直接挂载容器配置文件可行吗?

这些 gpu-manager 要做的工作都是 device plugin 的 Allocate 调用提供的能力。所以 gpu-manager 需要在 Allocate 期间完成这么多的工作。这也是这部分比较复杂的原因。下面我们带着这些信息去看代码,会更容易懂一些。下面的代码都是来自于 pkg/services/allocator/nvidia/allocator.go 中的 Allocate 方法,但是因为很长,所以我会截取出来分析。

// k8s send allocate request for one container at a time
req := reqs.ContainerRequests[0]
resps := &pluginapi.AllocateResponse{}
reqCount = uint(len(req.DevicesIDs))

这部分取了 Allocate 中的第一个 ContainerRequest,通过注释知道,k8s 一次只为一个容器发送分配请求。

    if ta.unfinishedPod != nil {

    } else {

    }

接下来有一个对 unfinishedPod 的判断,因为 k8s 一次请求只针对一个容器,因此这里的 unfinishedPod 指的是只分配了部分容器,还有其他容器没有分配的 pod。这里我们需要仔细思考一下,使用 unfinishedPod 的目的是什么?看到这里我有两个猜测:

  1. 因为 k8s 一次请求只针对一个容器,所以为了优先分配完一个 pod,就需要标记 unfinishedPod 了。但是仔细想想,因为 Allocate 的请求和响应中都没有容器的信息,所以本次请求分配的容器是由 kubelet 决定的。device plugin 并没有能力改变容器的分配顺序,这个想法是错的。
  2. 为了性能考虑。因为 gpu-manager 有两个 device plugin:vmemory 和 vcore。但是之前说到 vmemory 的分配没有做任何工作。所以我们不得不在分配 vcore 的时候,把 vmemory 的分配工作也做了。可是我怎么知道当前正在给哪个容器分配资源?那我也更不知道分配多少 vmemory 了。但是天无绝人之路啊,我可以遍历当前节点上的所有 pod,然后挑出需要 gpu 资源的 pod。然后再从这些 pod 中挑出符合这次请求的容器。这里如果使用 unfinishedPod 就避免了重复的大规模查找操作。

那么,假设现在还有一个未完成的 pod,会执行下面的代码

// 候选pod
candidatePod = ta.unfinishedPod
// 从已分配的pod中查找
cache := ta.allocatedPod.GetCache(string(candidatePod.UID))
if cache == nil {
    msg := fmt.Sprintf("failed to find pod %s in cache", candidatePod.UID)
    glog.Infof(msg)
    return nil, fmt.Errorf(msg)
}
for i, c := range candidatePod.Spec.Containers {
    if _, ok := cache[c.Name]; ok {
        continue
    }

    if !utils.IsGPURequiredContainer(&c) {
        continue
    }

    if reqCount != utils.GetGPUResourceOfContainer(&candidatePod.Spec.Containers[i], types.VCoreAnnotation) {
        msg := fmt.Sprintf("allocation request mismatch for pod %s, reqs %v", candidatePod.UID, reqs)
        glog.Infof(msg)
        return nil, fmt.Errorf(msg)
    }
    // 候选的容器(应该就是待分配资源的容器)
    candidateContainer = &candidatePod.Spec.Containers[i]
    found = true
    break
}

上面这段代码遍历这个 pod 的容器列表,然后和缓存中的容器对比,如果没有分配并且需要 gpu 资源,并且容器请求的资源量和当前的分配请求一致,就认定这个容器是我们接下来要为之分配的候选人了。这里我们又有一个问题 B,如果一个 Pod 中有多个 vcore 请求一致,但是 vmemory 不同的容器,这里只通过 vcore 的请求量来判断,可以保证这个分配请求和我们的候选容器能对的上吗?这个问题我们可以产生如下的猜测:

  1. AllocateRequest 是按照 Pod 中的容器顺序来的,这样我们在做 reqCount 对比的时候,因为顺序一致就能保证请求和候选容器是对应关系了。那么,AllocateRequest 是按照 Pod 中容器顺序来的吗?这是一个新的问题 C。
  2. 其实请求和候选容器不对应也没关系,因为容器中进行 cuda 调用拦截的时候,才会请求 virtual manager,拿到容器的资源限制配置信息。只要这个环节能保证容器和其请求的资源量对应上,就不会有任何问题?这也是我们的问题 E:cuda 调用拦截的时候,如何保证容器和配置的对应关系。这也和问题 A 相呼应,如果这个猜测成立,那就是为什么问题 A 中要大费周折的使用 grpc 调用下发配置,而不是直接把配置信息挂载或写到容器的变量中。

接下来我们继续看,如果没有未完成的容器,就执行以下代码:

// 获取候选的pod,候选的pod是当前节点上的需要GPU,没有分配并且不应该删除的pod
pods, err := getCandidatePods(ta.k8sClient, ta.config.Hostname)
if err != nil {
    msg := fmt.Sprintf("Failed to find candidate pods due to %v", err)
    glog.Infof(msg)
    return nil, fmt.Errorf(msg)
}

for _, pod := range pods {
    if found {
        break
    }
    for i, c := range pod.Spec.Containers {
        if !utils.IsGPURequiredContainer(&c) {
            continue
        }
        podCache := ta.allocatedPod.GetCache(string(pod.UID))
        if podCache != nil {
            if _, ok := podCache[c.Name]; ok {
                glog.Infof("container %s of pod %s has been allocate, continue to next", c.Name, pod.UID)
                continue
            }
        }
        if utils.GetGPUResourceOfContainer(&pod.Spec.Containers[i], types.VCoreAnnotation) == reqCount {
            glog.Infof("Found candidate Pod %s(%s) with device count %d", pod.UID, c.Name, reqCount)
            candidatePod = pod
            candidateContainer = &pod.Spec.Containers[i]
            found = true
            break
        }
    }
}

和上面的不同之处,就是在获取候选 pod 这里。获取候选 pod 的代码如下:

    candidatePods := []*v1.Pod{}
    allPods, err := getPodsOnNode(client, hostname, string(v1.PodPending))

    for _, pod := range allPods {
        current := pod
        if utils.IsGPURequiredPod(¤t) && !utils.IsGPUAssignedPod(¤t) && !utils.ShouldDelete(¤t) {
            candidatePods = append(candidatePods, ¤t)
        }
    }

    return OrderPodsdByPredicateTime(candidatePods), nil

先是获取节点上的所有 pod,然后从节点上的 pod 中选取需要 GPU,并且没有分配 GPU,并且不应该删除的 pod。最后得到一个候选 pod 列表。最后对这个列表根据时间排序。这样就可以拿到最先被调度的 pod 了。这里其实也默认了一个前提,最先调度的 pod 会最先发出分配请求。这里还有一个需要注意的地方,排序依据的时间有两个选择:预选时间或创建时间。

    if predicateTimeStr, ok := pod.ObjectMeta.Annotations[types.PredicateTimeAnnotation]; ok {
        u64, err := strconv.ParseUint(predicateTimeStr, 10, 64)
        if err != nil {
            glog.Warningf("Failed to parse predicate Timestamp %s due to %v", predicateTimeStr, err)
        } else {
            predicateTime = u64
        }
    } else {
        // If predicate time not found, use createionTimestamp instead
        predicateTime = uint64(pod.ObjectMeta.CreationTimestamp.UnixNano())
    }

    return predicateTime

其中,预选时间并不是 kube-scheduler 添加的,而是和 gpu-manager 配合使用的 gpu-admission 这个项目。如果没有预选时间,就会使用 pod 的创建时间。这也就是说,我们不使用 gpu-admission 这个项目,也可以正常使用 gpu-manager。其实这里还有一个问题 D,我怎么保证挑出来的容器就是这次分配请求的呢?这个问题还要留在后面的分析中。

现在我们拿到了候选容器,就需要进行真正的分配工作了。

// get vmemory info from container spec
vmemory := utils.GetGPUResourceOfContainer(candidateContainer, types.VMemoryAnnotation)
for i := 0; i < int(vmemory); i++ {
    req.DevicesIDs = append(req.DevicesIDs, types.VMemoryAnnotation)
}

resp, err := ta.allocateOne(candidatePod, candidateContainer, req)
if err != nil {
    glog.Errorf(err.Error())
    return nil, err
}
resps.ContainerResponses = append(resps.ContainerResponses, resp)

这段代码中,我们拿到容器的 vmemory 信息。因为 vmemory 是根据数量划分的。1 个 vmemory 相当于 256M 的 memory,也就是一个 deviceID。这里请求多少的 vmemory,就存多少个 deviceID。然后调用 allocateOne 为单个容器进行真正的分配工作。下面我们开始分析 allocateOne 的分配逻辑。

var (
    nodes                       []*nvtree.NvidiaNode
    needCores, needMemoryBlocks int64
    predicateMissed             bool
    allocated                   bool
)

// 是否是 gpu 预选 pod
predicateMissed = !utils.IsGPUPredicatedPod(pod)
// 单节点的总内存
singleNodeMemory := int64(ta.tree.Leaves()[0].Meta.TotalMemory)
for _, v := range req.DevicesIDs {
    if strings.HasPrefix(v, types.VCoreAnnotation) {
        // 请求 core
        needCores++
    } else if strings.HasPrefix(v, types.VMemoryAnnotation) {
        // 请求 memory
        needMemoryBlocks++
    }
}

首先就是根据 deviceID 来计算需要多少 core 和 memory。接下来会调用 ta.recycle() 回收资源。回收的逻辑如下:

func (ta *NvidiaTopoAllocator) recycle() {
    activePods := watchdog.GetActivePods()

    lastActivePodUids := sets.NewString()
    activePodUids := sets.NewString()
    for _, uid := range ta.allocatedPod.Pods() {
        lastActivePodUids.Insert(uid)
    }
    for uid := range activePods {
        activePodUids.Insert(uid)
    }

    // difference 出来的就是已经运行结束的pod,可以回收分配的gpu资源
    podsToBeRemoved := lastActivePodUids.Difference(activePodUids)

    glog.V(5).Infof("Pods to be removed: %v", podsToBeRemoved.List())

    // 释放资源
    ta.freeGPU(podsToBeRemoved.List())
}

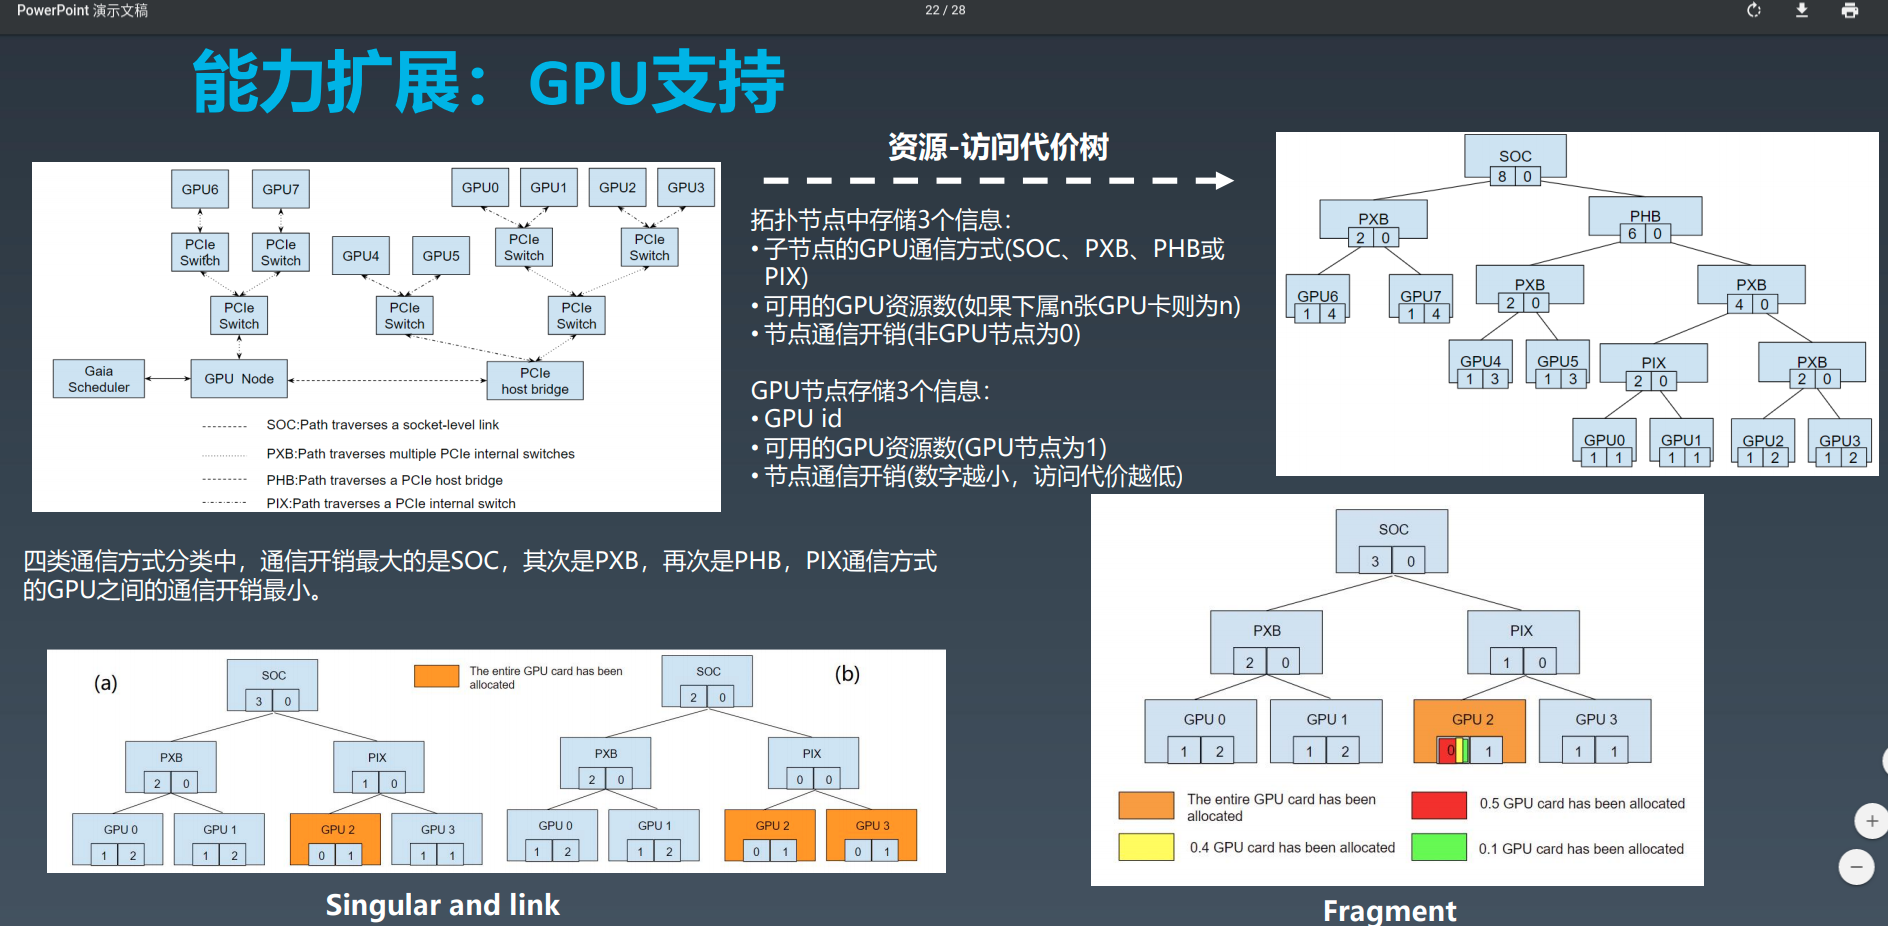
对已分配的 pod 和 正在运行的 pod 集合取差集,差集就是分配了资源但是已经停止运行的 pod 。然后对这部分 pod 释放 GPU 资源。具体的释放逻辑放在后面分析。现在继续向下看,这里我们直接跳到尝试分配资源的逻辑上。分配 gpu 资源分为三种情况:

  1. 如果需要的核心数大于 100,也就是说超过一个物理 GPU,就使用 link 评估器来选出 GPU 节点
  2. 如果正好是一个 100 核心,则使用 fragment 评估器
  3. 如果小于 100 核心,则使用 share 评估器。

情况 1 的代码如下:

eval, ok := ta.evaluators["link"]
if !ok {
    return nil, fmt.Errorf("can not find evaluator link")
}
if needCores%nvtree.HundredCore > 0 {
    return nil, fmt.Errorf("cores are greater than %d, must be multiple of %d", nvtree.HundredCore, nvtree.HundredCore)
}
nodes = eval.Evaluate(needCores, 0)

注意到这里还要求请求的核心数必须是 100 的整数,也就是说必须是整数个物理 GPU,你不能请求 1.5 个 物理 GPU 这种。

情况 2 的代码如下:

eval, ok := ta.evaluators["fragment"]
if !ok {
    return nil, fmt.Errorf("can not find evaluator fragment")
}
nodes = eval.Evaluate(needCores, 0)

情况 3 的代码如下:

// EnableShare 是在启动时指定的参数,代表是否允许多个容器共享一个gpu
if !ta.config.EnableShare {
    return nil, fmt.Errorf("share mode is not enabled")
}
if needCores == 0 || needMemory == 0 {
    return nil, fmt.Errorf("that cores or memory is zero is not permitted in share mode")
}

// evaluate in share mode
shareMode = true
// 使用 share 评估
eval, ok := ta.evaluators["share"]
if !ok {
    return nil, fmt.Errorf("can not find evaluator share")
}
// 评估出来的合适的 nvidia gpu 节点
nodes = eval.Evaluate(needCores, needMemory)
if len(nodes) == 0 {
    if shareMode && needMemory > singleNodeMemory {
        return nil, fmt.Errorf("request memory %d is larger than %d", needMemory, singleNodeMemory)
    }

    return nil, fmt.Errorf("no free node")
}

在评估出来节点之后,会先判断这个这个 pod 是否真的经过预选阶段?判断方法如下:

func IsGPUPredicatedPod(pod *v1.Pod) (predicated bool) {
    glog.V(4).Infof("Determine if the pod %s needs GPU resource", pod.Name)
    var ok bool

    // Check if pod request for GPU resource
    if GetGPUResourceOfPod(pod, types.VCoreAnnotation) <= 0 || GetGPUResourceOfPod(pod, types.VMemoryAnnotation) <= 0 {
        glog.V(4).Infof("Pod %s in namespace %s does not Request for GPU resource",
            pod.Name,
            pod.Namespace)
        return predicated
    }

    // Check if pod already has predicate time
    // tencent.com/predicate-time 是 gpu-admission 中添加的。
    if _, ok = pod.ObjectMeta.Annotations[types.PredicateTimeAnnotation]; !ok {
        glog.V(4).Infof("No predicate time for pod %s in namespace %s",
            pod.Name,
            pod.Namespace)
        return predicated
    }

    // Check if pod has already been assigned
    if assigned, ok := pod.ObjectMeta.Annotations[types.GPUAssigned]; !ok {
        glog.V(4).Infof("No assigned flag for pod %s in namespace %s",
            pod.Name,
            pod.Namespace)
        return predicated
    } else if assigned == "true" {
        glog.V(4).Infof("pod %s in namespace %s has already been assigned",
            pod.Name,
            pod.Namespace)
        return predicated
    }
    predicated = true
    return predicated
}

共有三个要求才算经过了预选:

  • resource 字段请求了 vcore 和 vgpu,并且大于 0。
  • 必须有 tencent.com/predicate-time 字段。这点要求必须经过 gpu-admission 的预选阶段。
  • 没有被分配 gpu 资源

如果经过预选的话,就需要执行以下的逻辑:

// get predicate node by annotation
containerIndex, err := utils.GetContainerIndexByName(pod, container.Name)
if err != nil {
    return nil, err
}
var devStr string
if idxStr, ok := pod.ObjectMeta.Annotations[types.PredicateGPUIndexPrefix+strconv.Itoa(containerIndex)]; ok {
    if _, err := strconv.Atoi(idxStr); err != nil {
        return nil, fmt.Errorf("predicate idx %s invalid for pod %s ", idxStr, pod.UID)
    }
    devStr = types.NvidiaDevicePrefix + idxStr
    if !utils.IsValidGPUPath(devStr) {
        return nil, fmt.Errorf("predicate idx %s invalid", devStr)
    }
} else {
    return nil, fmt.Errorf("failed to find predicate idx for pod %s", pod.UID)
}

predicateNode := ta.tree.Query(devStr)
if predicateNode == nil {
    return nil, fmt.Errorf("failed to get predicate node %s", devStr)
}

// check if we choose the same node as scheduler
if predicateNode.MinorName() != nodes[0].MinorName() {
    return nil, fmt.Errorf("Nvidia node mismatch for pod %s(%s), pick up:%s  predicate: %s",
        pod.Name, container.Name, nodes[0].MinorName(), predicateNode.MinorName())
}

也就是说,经过预选阶段的 Pod 都会根据容器的顺序在 Annotations 为该容器写上配置信息。这说明在 gpu-admission 这个项目中会为容器分配 gpu 设备。最后还要检查一下在 gpu-manager 中分配的 gpu 设备和 gpu-admission 中是否一致,不一致的话也会返回分配失败。

现在我们已经知道要为当前请求的容器分配哪个 gpu 设备,以及分配的资源数量。这样就可以构建 ContainerAllocateResponse 了。先把已分配的设备放到响应中:

    for _, n := range nodes {
        name := n.MinorName()
        glog.V(2).Infof("Allocate %s for %s(%s), Meta (%d:%d)", name, pod.UID, container.Name, n.Meta.ID, n.Meta.MinorID)

        ctntResp.Annotations[types.VCoreAnnotation] = fmt.Sprintf("%d", needCores)
        ctntResp.Annotations[types.VMemoryAnnotation] = fmt.Sprintf("%d", needMemory)

        ctntResp.Devices = append(ctntResp.Devices, &pluginapi.DeviceSpec{
            ContainerPath: name,
            HostPath:      name,
            Permissions:   "rwm",
        })
        deviceList = append(deviceList, n.Meta.UUID)

        if !allocated {
            // 在 gpu tree 中标记设备已占用
            ta.tree.MarkOccupied(n, needCores, needMemory)
        }
        allocatedDevices.Insert(name)
    }

更改响应的 Annotations:

ctntResp.Annotations[types.VDeviceAnnotation] = vDeviceAnnotationStr(nodes)

检查 pod 的所有容器是否都完成了分配,并把新的分配信息写入到 checkpoint:

unfinished := false
for _, c := range pod.Spec.Containers {
    if !utils.IsGPURequiredContainer(&c) {
        continue
    }
    podCache := ta.allocatedPod.GetCache(string(pod.UID))
    if podCache != nil {
        if _, ok := podCache[c.Name]; !ok {
            unfinished = true
            break
        }
    }
}
if unfinished {
    ta.unfinishedPod = pod
} else {
    ta.unfinishedPod = nil
}
ta.writeCheckpoint()

在响应中为容器添加 /dev/nvidiactl/dev/nvidia-uvm,如果配置了 extraConfig,还会把里面要默认添加的设备加进去:

// Append control device
ctntResp.Devices = append(ctntResp.Devices, &pluginapi.DeviceSpec{
    ContainerPath: types.NvidiaCtlDevice,
    HostPath:      types.NvidiaCtlDevice,
    Permissions:   "rwm",
})

ctntResp.Devices = append(ctntResp.Devices, &pluginapi.DeviceSpec{
    ContainerPath: types.NvidiaUVMDevice,
    HostPath:      types.NvidiaUVMDevice,
    Permissions:   "rwm",
})

// Append default device
if cfg, found := ta.extraConfig["default"]; found {
    for _, dev := range cfg.Devices {
        ctntResp.Devices = append(ctntResp.Devices, &pluginapi.DeviceSpec{
            ContainerPath: dev,
            HostPath:      dev,
            Permissions:   "rwm",
        })
    }
}

此时,响应中的设备信息已经处理结束,接下来处理容器中的环境变量,gpu manager 需要通过修改 LD_LIBRARY_PATH 来劫持程序对 cuda 的调用,然后通过 NVIDIA_VISIBLE_DEVICES 来让挂载的设备可见。

// LD_LIBRARY_PATH
ctntResp.Envs["LD_LIBRARY_PATH"] = "/usr/local/nvidia/lib64"
for _, env := range container.Env {
    if env.Name == "compat32" && strings.ToLower(env.Value) == "true" {
        ctntResp.Envs["LD_LIBRARY_PATH"] = "/usr/local/nvidia/lib"
    }
}

// NVIDIA_VISIBLE_DEVICES
ctntResp.Envs["NVIDIA_VISIBLE_DEVICES"] = strings.Join(deviceList, ",")

接着根据是否处于 shareMode,也就是单个 gpu 能否被共享来挂载不同的 host 目录。

if shareMode {
    // nvidia 是劫持的库,用在shareMode这种情况
    ctntResp.Mounts = append(ctntResp.Mounts, &pluginapi.Mount{
        ContainerPath: "/usr/local/nvidia",
        HostPath:      types.DriverLibraryPath,
        ReadOnly:      true,
    })
} else {
    // 非shareMode用正常的库即可
    ctntResp.Mounts = append(ctntResp.Mounts, &pluginapi.Mount{
        ContainerPath: "/usr/local/nvidia",
        HostPath:      types.DriverOriginLibraryPath,
        ReadOnly:      true,
    })
}

shareMode 下,会挂载的 host 目录是 /etc/gpu-manager/vdriver/nvidia,这里面是被劫持的库。否则挂载 /etc/gpu-manager/vdriver/origin,里面是原始的 CUDA 库。

紧接着,将 host 上的 /etc/gpu-manager/vm/{podUID} 挂载到容器中,这个是为了容器内可以通过 vcuda.sockvirtual-manager 通信。

// 将host上的/etc/gpu-manager/vm/podUID挂载进去(vcuda.sock),这个目录是在PreStartContainer期间由VirtualManager创建的
ctntResp.Mounts = append(ctntResp.Mounts, &pluginapi.Mount{
    ContainerPath: types.VCUDA_MOUNTPOINT,
    HostPath:      filepath.Join(ta.config.VirtualManagerPath, string(pod.UID)),
    ReadOnly:      true,
})

如果当前请求的容器所属 Pod 没有经过 gpu-admission,还会被放到一个处理队列中:

if predicateMissed {
    ar := &allocateResult{
        pod:     pod,
        result:  PREDICATE_MISSING,
        resChan: make(chan struct{}),
    }

    // 这个 queue 的处理是在virtualmanager里面的process方法
    ta.queue.AddRateLimited(ar)
    <-ar.resChan
}

这个队列会在 pkg/service/allocator/nvidia/allocator.goproccessResult 中处理。

这样,kubelet 调用 Allocate 方法就结束了。这里再来回顾一下上面遗留的问题和相关逻辑:

问题:

  • 问题 A: 为什么要大费周章的通过 grpc,直接挂载容器配置文件可行吗?

    总结: 这一点在上面的阅读中可以发现,这时候容器本身对自己应该限制多少的 gpu 资源调用并不知道。这个问题得和 B/C/D 问题结合来看。因为做 Allocate 调用时,kubelet 并没有告知此时在为哪个容器请求配置。因此只能根据请求的资源量以及 Pod 的 predicateTime 或 createTime 来判断。这个是无法保证一定准确的,因此此时容器的具体资源配置也无法确定。可能这就是要通过 grpc 而不是挂载容器配置文件的原因吧。

  • 问题 B: 如果一个 Pod 中有多个 vcore 请求一致,但是 vmemory 不同的容器,这里只通过 vcore 的请求量来判断,可以保证这个分配请求和我们的候选容器能对的上吗?
    总结:问题 B 是在 unfinisedPod 中查找当前请求的容器。只要能保证 unfinishedPod 是正确的(问题 D 说明不能保证),那么就可以保证容器是对的上的(问题 C 保证了这个结论)。

  • 问题 C: AllocateRequest 是按照 Pod 中的容器顺序来的?
    总结:对于这个问题,最好的回答方式是去看 kubelet 的源代码。

    for _, container := range pod.Spec.Containers {
        if err := m.allocateContainerResources(pod, &container, devicesToReuse); err != nil {
            return err
        }
        m.podDevices.removeContainerAllocatedResources(string(pod.UID), container.Name, devicesToReuse)
    }
    

    这边做 Allocate 的时候,是顺序遍历 Pod 中的容器,因此这个问题的答案是肯定的。

  • 问题 D: 遍历当前节点上的所有 pod,然后挑出需要 gpu 资源的 pod,根据 predicatedTimecreateTime 排序。然后再从这些 pod 中, 按顺序挑出符合这次请求的容器,怎么保证挑出来的容器就是这次分配请求的呢?

    总结:我觉得回答这个问题,需要确定两个大前提,一是 Pod 从创建到发起 Allocate 的过程,都是顺序的。这样就能保证当调用 Allocate 对应的 Pod 永远是尚未分配到资源的第一个。二是在一个 Pod 中,为每个容器 Allocate 时,也是顺序的,这一点在问题 C 中得到确认。

    但是实际上,第一个前提是不能保证的,在 Pod bind 到节点时,这个是并发执行的。因此可以得出一个结论:在这个阶段无法保证 Allocate 请求和我们的候选容器是对应关系。关于这一点我也提了个 issue:a question about Allocate for a container?。官方也给了回答,因为这个原因 gpu manager 有时候会报 UnexpectedAdmissionError 错误。

    所以根据问题 4,我们还要使用 gpu-admission 这个项目,来保证该阶段的正确性,具体机制还得等到看 gpu-admission 的时候才能知道了。

其实以上四个问题都是因为 kubelet 的 Allocate 请求不会带上正在分配的容器。所以需要一系列的查找方式来确定具体的容器。

因为篇幅问题,关于 gpu 的最佳分配策略会作为下一篇文章的内容。

参考资料

从零开始入门 K8s:调度器的调度流程和算法介绍

kubernetes 的挂载传播(mount propagation)机制

概述

今天在看 kubectl-debug 这个项目的时候,看到其部署文件的 volumeMounuts 中使用了一个 mountPropagation 字段,因为不清楚这个字段的作用,就做了一下了解。mount propagation 背后的东西还是很多的,因此整理了这篇文章,顺便梳理一下知识点。

kubernetes 的 mount propagation 翻译成中文就是挂载传播。挂载传播提供了共享卷挂载的能力,它允许在同一个 Pod,甚至同一个节点内,在多个容器之间共享卷的挂载。

kubernetes 的挂载传播

卷的挂载传播由 Container.volumeMounts 的 mountPropagation 字段控制。它的值有:

  • None: 这种卷挂载将不会收到任何后续由 host 创建的在这个卷上或其子目录上的挂载。同样的,由容器创建的挂载在 host 上也是不可见的。这是默认的模式。这个其实很好理解,就是容器内和 host 的后续挂载完全隔离。

  • HostToContainer: 这种卷挂载将会收到之后所有的由 host 创建在该卷上或其子目录上的挂载。换句话说,如果 host 在卷挂载内挂载的任何内容,在容器中都是可见的。同样,如果任何具有 Bidirectional 的 Pod 挂载传播到该卷挂载上,具有 HostToContainer 的挂载传播都可以看见。整个挂载传播的流程如下:

  • Bidirectional: 这种挂载机制和 HostToContainer 类似。此外,任何在容器中创建的挂载都会传播到 host,然后传播到使用相同卷的所有 Pod 的所有容器。注意:Bidirectional 挂载传播是很危险的。可能会危害到 host 的操作系统。因此只有特权容器在允许使用它。

在了解了这几种挂载传播之后,我们可以做一些实验来验证一下,首先验证的是 None 的挂载传播类型,我们创建一个 nginx 的Pod:

apiVersion: v1
kind: Pod
metadata:
    name: mount-a
    namespace: default
    label:
      app: mount
spec:
    containers:
    - name: main
      image: nginx:latest
      volumeMounts:
      - name: testmount
        mountPath: /home
        mountPropagation: None
    volumes:
    - name: testmount
      hostPath:
        path: /mnt/

然后我们分别向 host 的 /mnt 和容器的 /home 下挂载目录并查看容器和 host 的情况:

容器中:

$ kubectl exec -it mount-a sh
$ cd /home
$ ls 
sda1

host 上:

$ cd /mnt
$ ls 
sda1

然后在 host 上创建挂载:

$ mkdir /mnt/none
$ sudo mount --bind /var /mnt/none
$ ls none
cache  empty  lib  lock  log  run  spool  tmp

这个时候,我们再看容器中的文件:

$ ls none
# 无输出

这说明 host 上在该卷下的挂载并不会改变容器中的文件。接下来我们可以在容器中按照上面的方案来验证容器中的挂载也不会影响 host 中的目录视图。这里就不展示了。接下来看一下 HostToContainer 的挂载传播,我们将上面的 Pod 的 mountPropagation 字段改成 HostToContainer,然后先取消 host 上的挂载:

sudo umoint /mnt/none

然后重新创建 Pod,和上面一样,在 host 上创建挂载,查看容器中的挂载情况:

$ ls none
cache  empty  lib  lock  log  run  spool  tmp

host 上的挂载因为 HostToContainer 机制传播到了容器中。我们继续看最后一种 Bidirectional 机制。这次我们要创建两个 Pod: mount-a, mount-b,并把 mountPropagation 字段改成 Bidirectional。注意,因为 Bidirectional 是危险的,所以只有特权容器才可以使用。因此这里还需要把容器改成特权模式,最后在 mount-a 中的容器执行挂载,验证挂载是否传播到 host 和 mount-b 的容器中。

apiVersion: v1
kind: Pod
metadata:
    name: mount-a
    namespace: default
    labels:
      app: mount
spec:
    containers:
    - name: main
      image: nginx:latest
      securityContext:
        privileged: true
      volumeMounts:
      - name: testmount
        mountPath: /home
        mountPropagation: Bidirectional
    volumes:
    - name: testmount
      hostPath:
        path: /mnt/
---
apiVersion: v1
kind: Pod
metadata:
    name: mount-b
    namespace: default
    labels:
      app: mount
spec:
    containers:
    - name: main
      image: nginx:latest
      securityContext:
        privileged: true
      volumeMounts:
      - name: testmount
        mountPath: /home
        mountPropagation: Bidirectional
    volumes:
    - name: testmount
      hostPath:
        path: /mnt/

然后进入 mount-a,创建挂载:

$ kubectl exec -it mount-a sh
$ su
$ mount --bind /var /home/none
$ ls /home/none
backups  lib    lock  mail  run    tmp
cache    local  log   opt   spool

这时候查看 host 下的 /mnt/none:

$ ls /mnt/none
backups  lib    lock  mail  run    tmp
cache    local  log   opt   spool

可以发现,容器中的挂载传播到了 host 上。这时候再查看 mount-b 中的容器。

$ ls /home/none
backups  lib    lock  mail  run    tmp
cache    local  log   opt   spool

挂载也传播到了 mount-b 的容器中。

linux mount 的几种类型

上面分析了 kubernetes 的挂载传播机制,在 linux mount 中,也有类似的概念。mount 分为下面几种:

  • shared mount: 相当于上面所说的 Bidirectional 的挂载传播
  • slave mount: 每个 slave mount 都有一个 shared master mount,挂载传播只能从 master -> slave,等同于上面的 HostToContainer, host 是 master,container 是 slave。
  • private mount: 很明显,private 就是相当于 None,挂载不会向任何一方传播。
  • unbindable mount:unbindable mount 其实就是 unbindable private mount,也就是不允许使用 --bind 的挂载。

mount namespace 的机制

kubernetes 的挂载传播不是其本身实现的,也不是 docker 之类的容器运行时提供的。这是由容器化技术的基础:linux namespace 提供的,linux namespace 当前共有 6 种:

  • cgroup namespace: 隔离 cgroup 根目录
  • pid namespace: 隔离进程 id
  • ipc namespace: 隔离 System V IPC, POSIX message queues
  • uts namespace: 隔离 Hostname 和 NIS domain name
  • user namespace: 隔离用户和用户组 ID
  • mount namespace: 隔离挂载点
  • network namespace: 隔离网络设备,网络栈,端口等

其中,mount namespace 是这篇文章的重点。我们可以通过 clone 调用来看看 mount namespace 的使用:

#define _GNU_SOURCE
#include <stdio.h>
#include <sys/types.h>
#include <sys/wait.h>
#include <sys/mount.h>
#include <sched.h>
#include <signal.h>
#include <unistd.h>

#define STACK_SIZE (1024*1024)
static char container_stack[STACK_SIZE];

char* const container_args[] = {
    "/bin/bash",
    NULL
};

int container_main(void* arg)
{
    printf("Container [%5d] - inside the container!\n", getpid());
    mount("none", "/", NULL, MS_REC|MS_PRIVATE, NULL);
    execv(container_args[0], container_args);
    printf("Something's wrong!\n");
    return 1;
}
int main()
{
    printf("Parent [%5d] - start a container!\n", getpid());
    /* 启用Mount Namespace - 增加CLONE_NEWNS参数 */
    int container_pid = clone(container_main, container_stack+STACK_SIZE, CLONE_NEWNS | SIGCHLD, NULL);
    waitpid(container_pid, NULL, 0);
    printf("Parent - container stopped!\n");
    return 0;
}

编译运行:

$ gcc main.c -o mount
$ sudo ./mount

然后尝试挂载,来验证挂载 MS_PRIVATE 的挂载传播问题。MS_PRIVATE 下 namespace 内和 host 应该是隔离的。MS_PRIVATE 还可以替换成 MS_UNBINDABLEMS_SLAVEMS_SHARED

关于更多的 namespace 的资料,建议看这两篇文章:

参考资料

[Gaia Scheduler] gpu-manager 启动流程分析

概述

Gaia scheduler 是腾讯开源的在 Kubernetes 集群中做 GPU 虚拟化的方案,实现了为容器分配虚拟化 GPU 资源并加以限制,它的最大的优势就是不需要特殊的硬件支持,并且性能损耗很小。关于它的论文,地址在这里:Gaia Scheduler: A Kubernetes-Based Scheduler Framework。如果想要理解这个项目,强烈建议先读这篇论文。

Gaia Scheduler 可以分为 4 个组件:

  • GPU Manager: 作为 device plugin 向 kubelet 注册。共注册了两个设备,包括 vcore 和 vmemory,支持两种计算资源:tencent.com/vcuda-coretencent.com/vcuda-memory,分别用来做 GPU 计算资源和 GPU 内存资源的请求和限制。

  • GPU Scheduler: 这里的 scheduler 并不是 kubernetes 的调度器,是 GPU Manager 在收到 kubelet 的 Allocate 调用后,它需求将设备挂载给容器。为了实现最佳的 GPU 挂载,就有这样一个专门的 Scheduler 来根据节点上当前的 GPU 拓扑和资源占用情况进行调度。

  • vGPU Manager: vGPU Manager 是具体负责管理容器的组件,包括监控容器状态,传递配置,和容器内的vGPU Library通信,以及在容器死亡后进行回收操作。

  • vGPU Library: vGPU Library 虽然相关的代码量不多,但它是 Gaia Scheduler 最重要的部分。因为它是实现 GPU 虚拟化的核心。通过覆盖容器中的 LD_LIBRARY_PATH 以及自定义了 libcuda-control.so 实现对 CUDA API 的拦截。

Gaia Scheduler 主要由三个项目组成: gpu-managervcuda-controllergpu-admission。但是这里的 gpu-manager 是 Gaia Scheduler 的主要实现,包含了上述的 4 个组件,vcuda-controller 就是 vGPU Library,已经被打包到了 gpu-manager 这个项目中。gpu-manager 需要配合 gpu-admission 项目来完成 GPU Scheduler 的工作。不要因此产生误解。下文中我们主要就 gpu-manager 这个项目进行分析。

启动流程分析

gpu-manager 本身主要作为 kubernetes 的 device plugin 来实现的,定义了两种设备: vcuda-corevcuda-memory,我们的应用通过 pod 的资源字段进行申请,然后 kube-scheduler 会根据节点上的资源状态进行调度。因此,你最好还需要了解 kubernetes 的 device plugin 的开发知识。关于 device plugin 的开发,可以看之前的一篇文章:Kubernetes开发知识–device-plugin的实现

启动参数

分析一个项目从启动参数开始,可以帮助我们快速了解:

  • driver: 这个是 GPU 的驱动,当前的默认值是 nvidia,很显然该项目可以扩展支持其他类型的 GPU。
  • extra-config: 额外的配置,这个参数暂时看不出来有什么特别
  • volume-config: 这里的 volume 指的是一些动态链接库和可执行文件的位置。也就是 gpu-manager 需要拦截调用的一些库
  • docker-endpoint: 用来挂载到容器中和 docker 做通信的,默认位置是 unix:////var/run/docker.sock
  • query-port: 统计信息服务的查询接口
  • query-port: 统计信息服务的监听地址
  • kubeconfig: 用来授权的配置文件
  • standalone: 暂时还不清楚的参数
  • sample-period: gpu-manager 会查询 gpu 设备的使用情况,这个参数用来设定采样周期
  • node-labels: 给节点自动打标签
  • hostname-override: gpu-manager 在运行时,只关注自己节点上的 pod,这主要是通过 hostname 来辨认的
  • virtual-manager-path: gpu-manager 会为所有需要虚拟 gpu 资源的 pod 创建唯一的文件夹,文件夹的路径就在这个地址下。
  • device-plugin-path: kubernetes 默认的 device plugin 的目录地址
  • checkpoint-path: gpu-manager 会产生 checkpoint 来当缓存用
  • share-mode: gpu-manager 最大的特点就是将一个物理 gpu 分成多个虚拟 gpu,也就是共享模式
  • allocation-check-period: 检查分配了虚拟 gpu 资源的 pod 的状态,及时回收资源
  • incluster-mode: 是否在集群内运行

服务启动

gpu-manager 推荐的部署方案是通过 kubernetes 的 daemonset,然后配置 node selector 调度到指定的节点上。然后 gpu-manager 就开始在指定节点上启动了。

srv := server.NewManager(cfg)
go srv.Run()

这里,我们需要看一下这个 srv 的具体实现,首先是它的结构体:

type managerImpl struct {
    config *config.Config

    allocator      allocFactory.GPUTopoService     // gpu 容器调度分配
    displayer      *display.Display                // gpu 使用情况可视化服务
    virtualManager *vitrual_manager.VirtualManager // 负责管理 vgpu

    bundleServer map[string]ResourceServer
    srv          *grpc.Server
}

config 包含了我们上面的所有参数,就不进去细看了。

allocator 负责在容器调度到节点上后,为其分配具体的设备资源。allocator 实现了探测节点上的 gpu 拓扑架构,然后以最佳性能,最少碎片为目的使用最优的方案进行资源分配。

displayer 是将 gpu 的使用情况输出,方便我们查看。

virtualManager 负责 vgpu 分配后的管理工作。

bundleServer 包含 vcore,vmemory,我们上面提到这两种资源以 device plugin 的方式进行注册,因此他们需要启动 grpc server。

srv: 将 gpu display server 注册到这个 grpc server 中。

接下来,我们就可以分析 srv.Run() 方法具体执行了哪些内容。为了先对整个流程有个大概的印象,我将内容整理成以下条目:

  • 启动 volumeManager,将节点上和 nvidia gpu (包括cuda) 的所有可执行文件和库移动到 /etc/gpu-manager/vdriver 中。并且将关键的库替换成 vcuda-control,实现 cuda 调用的拦截。
  • watchdog 创建 pod 缓存并监控 pod,之后所有关于 pod 的操作都来源于这里。
  • watchdog 给节点打上标签
  • 启动 virtualManager
  • gpu 拓扑结构感知。
  • 初始化资源分配器
  • 设置 vcuda, vmemory, display 的 grpc 服务
  • 启动 metrics 的 http 服务,主要是提供给 prometheus
  • 启动 vcuda,vmemory 的 grpc 服务
  • 启动 display 的 grpc 服务

接下来,我们具体来分析每一步是如何做的。当然,这里只会挑一些重点的部分。

volumeManager 的启动

func (vm *VolumeManager) Run() (err error) {
    // ldcache 是动态链接库的缓存信息
    cache, err := ldcache.Open()
    defer func() {
        if e := cache.Close(); err == nil {
            err = e
        }
    }()
    vols := make(VolumeMap)
    for _, cfg := range vm.Config {
        vol := &Volume{
            Path: path.Join(cfg.BasePath, cfg.Name),
        }

        if cfg.Name == "nvidia" {
            // nvidia 库的位置
            types.DriverLibraryPath = filepath.Join(cfg.BasePath, cfg.Name)
        } else {
            // origin 库的位置
            types.DriverOriginLibraryPath = filepath.Join(cfg.BasePath, cfg.Name)
        }

        for t, c := range cfg.Components {
            switch t {
            case "binaries":
                // 调用 which 来查找可执行文件的位置
                bins, err := which(c...)
                // 将实际位置存起来
                vol.dirs = append(vol.dirs, volumeDir{binDir, bins})
            case "libraries":
                // 是库的话,就从 ldcache 里面去找
                libs32, libs64 := cache.Lookup(c...)
                // 将 library 位置存起来
                vol.dirs = append(vol.dirs, volumeDir{lib32Dir, libs32}, volumeDir{lib64Dir, libs64})
            }
            vols[cfg.Name] = vol
        }
    }
    // 找到了需要的库位置之后,做 mirror 处理
    if err := vm.mirror(vols); err != nil {
        return err
    }
    return nil
}

这段代码的前半部分都是在查找指定的动态链接库和可执行文件,这些文件是在 volume.conf 这个配置文件中指定的,通过参数传进来。查找动态链接库时,使用的是 ldcache,查找可执行文件时,使用了系统的 which 指令。找到之后会将其所在位置记录下来。接着就是对找到的库做 mirror 处理。

func (vm *VolumeManager) mirror(vols VolumeMap) error {
    // nvidia 和 origin
    for driver, vol := range vols {
        if exist, _ := vol.exist(); !exist {
            // 这里的path是/etc/gpu-manager/vdriver下面
            if err := os.MkdirAll(vol.Path, 0755); err != nil {
                return err
            }
        }
        for _, d := range vol.dirs {
            vpath := path.Join(vol.Path, d.name)
            // 创建 bin lib lib64
            if err := os.MkdirAll(vpath, 0755); err != nil {
                return err
            }

            // For each file matching the volume components (blacklist excluded), create a hardlink/copy
            // of it inside the volume directory. We also need to create soname symlinks similar to what
            // ldconfig does since our volume will only show up at runtime.
            for _, f := range d.files {
                glog.V(2).Infof("Mirror %s to %s", f, vpath)
                if err := vm.mirrorFiles(driver, vpath, f); err != nil {
                    return err
                }

                if strings.HasPrefix(path.Base(f), "libcuda.so") {
                    driverStr := strings.SplitN(strings.TrimPrefix(path.Base(f), "libcuda.so."), ".", 2)
                    types.DriverVersionMajor, _ = strconv.Atoi(driverStr[0]) // 驱动版本号
                    types.DriverVersionMinor, _ = strconv.Atoi(driverStr[1])
                    glog.V(2).Infof("Driver version: %d.%d", types.DriverVersionMajor, types.DriverVersionMinor)
                }

                if strings.HasPrefix(path.Base(f), "libcuda-control.so") {
                    vm.cudaControlFile = f
                }
            }
        }
    }

    vCudaFileFn := func(soFile string) error {
        if err := os.Remove(soFile); err != nil {
            if !os.IsNotExist(err) {
                return err
            }
        }
        if err := clone(vm.cudaControlFile, soFile); err != nil {
            return err
        }

        glog.V(2).Infof("Vcuda %s to %s", vm.cudaControlFile, soFile)

        l := strings.TrimRight(soFile, ".0123456789")
        if err := os.Remove(l); err != nil {
            if !os.IsNotExist(err) {
                return err
            }
        }
        if err := clone(vm.cudaControlFile, l); err != nil {
            return err
        }
        glog.V(2).Infof("Vcuda %s to %s", vm.cudaControlFile, l)
        return nil
    }

    if vm.share && len(vm.cudaControlFile) > 0 {
        if len(vm.cudaSoname) > 0 {
            for _, f := range vm.cudaSoname {
                if err := vCudaFileFn(f); err != nil {
                    return err
                }
            }
        }

        if len(vm.mlSoName) > 0 {
            for _, f := range vm.mlSoName {
                if err := vCudaFileFn(f); err != nil {
                    return err
                }
            }
        }
    }

    return nil
}

这段代码先会对所有上面查找到的库或可执行文件调用 mirrorFiles,但是记录下来了 libcuda.so 的版本号和 libcuda-control.so 的位置。注意,这个 libcuda-control 就是 vcuda-control 项目生成的用来拦截 cuda 调用的库。

然后将 cudaControlFile clone到所有 cudaSonamemlSoName 中库的位置。这个 clone 方法会先尝试硬链接过去,如果失败就直接复制过去。这里的 cudaControlFile 就是我们上面所说的 libcuda-control.so 啦。cudaSonamemlSoName 包含了所有需要被拦截调用的库。这样子就实现了拦截所有的 cuda 调用。下面我们在看一下 mirrorFiles 这个方法就可以了。

// driver 是配置文件中的 "nvidia" 或 "origin"
// vpath 是要 mirror 到的位置,在 /etc/gpu-manager/vdriver 下面
func (vm *VolumeManager) mirrorFiles(driver, vpath string, file string) error {
    // In computing, the Executable and Linkable Format (ELF, formerly named Extensible Linking Format), is a common standard file format for executable files, object code, shared libraries, and core dumps
    obj, err := elf.Open(file)
    defer obj.Close()

    // 黑名单机制,具体用处还不清楚,跟 nvidia 的驱动相关
    ok, err := blacklisted(file, obj)
    if ok {
        return nil
    }
    l := path.Join(vpath, path.Base(file))
    // 不管有没有,先尝试把 gpu-manager 里面的移除
    if err := removeFile(l); err != nil {
        return err
    }
    // clone 优先硬连接,其次是复制文件到指定位置
    if err := clone(file, l); err != nil {
        return err
    }
    // 从 elf 中获取当前库的 soname
    soname, err := obj.DynString(elf.DT_SONAME)
    if len(soname) > 0 {
        // 将获取到 soname 组成路径
        l = path.Join(vpath, soname[0])
        // 如果文件和它的soname不一致(是否可以认为这个文件是软链接过去的)
        if err := linkIfNotSameName(path.Base(file), l); err != nil && !os.IsExist(err) {
            return err
        }

        // XXX Many applications (wrongly) assume that libcuda.so exists (e.g. with dlopen)
        // Hardcode the libcuda symlink for the time being.
        if strings.Contains(driver, "nvidia") {
            // 这里为什么要移除 libcuda.so 和 libnvidia-ml.so 的软链接
            // 因为gpu调用会涉及到这两个库,这两个库会软链接到真实的库上。移除后替换成拦截的库
            // Remove libcuda symbol link
            if vm.share && driver == "nvidia" && strings.HasPrefix(soname[0], "libcuda.so") {
                os.Remove(l)
                vm.cudaSoname[l] = l
            }

            // Remove libnvidia-ml symbol link
            if vm.share && driver == "nvidia" && strings.HasPrefix(soname[0], "libnvidia-ml.so") {
                os.Remove(l)
                vm.mlSoName[l] = l
            }

            // XXX GLVND requires this symlink for indirect GLX support
            // It won't be needed once we have an indirect GLX vendor neutral library.
            if strings.HasPrefix(soname[0], "libGLX_nvidia") {
                l = strings.Replace(l, "GLX_nvidia", "GLX_indirect", 1)
                if err := linkIfNotSameName(path.Base(file), l); err != nil && !os.IsExist(err) {
                    return err
                }
            }
        }
    }

    return nil
}

这段代码中,先使用 blacklisted 排除一些不需要处理的库,然后尝试将库或可执行文件 clone 到我们的 /etc/gpu-manager/vdriver 下面。/etc/gpu-manager/vdriver 下面有两个文件夹,一个是 nvidia,保存了已经被我们拦截的库,一个是 origin,这里面是原始的未处理的库。同时,还将 libcuda.so 和 libnvidia-ml.so 移除了,这样就调用不到真实的库了,转而在之后用我们拦截的库来替换这几个文件。

至此,volumeManager 分析结束。

gpu 拓扑结构感知

关于 gpu 拓扑结构这一块,主要是为了在之后做资源分配时选择最优方案用的。腾讯也有分享过这一块的资料(腾讯基于 Kubernetes 的企业级容器云实践):

gpu 拓扑结构

这里不影响我们理解整个工作机制,所以先不分析。

初始化资源分配器

// 分配器,根据driver调用相应的分配器
initAllocator := allocFactory.NewFuncForName(m.config.Driver)
if initAllocator == nil {
    return fmt.Errorf("can not find allocator for %s", m.config.Driver)
}

m.allocator = initAllocator(m.config, tree, client)

这里的 initAllocator 对应的方法是:

//NewNvidiaTopoAllocator returns a new NvidiaTopoAllocator
func NewNvidiaTopoAllocator(config *config.Config, tree device.GPUTree, k8sClient kubernetes.Interface) allocator.GPUTopoService {
    runtimeRequestTimeout := metav1.Duration{Duration: 2 * time.Minute}
    imagePullProgressDeadline := metav1.Duration{Duration: 1 * time.Minute}
    dockerClientConfig := &dockershim.ClientConfig{
        DockerEndpoint:            config.DockerEndpoint,
        RuntimeRequestTimeout:     runtimeRequestTimeout.Duration,
        ImagePullProgressDeadline: imagePullProgressDeadline.Duration,
    }

    _tree, _ := tree.(*nvtree.NvidiaTree)
    cm, err := checkpoint.NewManager(config.CheckpointPath, checkpointFileName)
    if err != nil {
        glog.Fatalf("Failed to create checkpoint manager due to %s", err.Error())
    }
    alloc := &NvidiaTopoAllocator{
        tree:              _tree,
        config:            config,
        evaluators:        make(map[string]Evaluator),
        dockerClient:      dockershim.NewDockerClientFromConfig(dockerClientConfig),
        allocatedPod:      cache.NewAllocateCache(),
        k8sClient:         k8sClient,
        queue:             workqueue.NewRateLimitingQueue(workqueue.DefaultControllerRateLimiter()),
        stopChan:          make(chan struct{}),
        checkpointManager: cm,
    }

    // Load kernel module if it's not loaded
    alloc.loadModule()

    // Initialize evaluator
    alloc.initEvaluator(_tree)

    // Read extra config if it's given
    alloc.loadExtraConfig(config.ExtraConfigPath)

    // Process allocation results in another goroutine
    go wait.Until(alloc.runProcessResult, time.Second, alloc.stopChan)

    // Recover
    alloc.recoverInUsed()

    // Check allocation in another goroutine periodically
    go alloc.checkAllocationPeriodically(alloc.stopChan)

    return alloc
}

allocator 调用 loadModule() 来启用 nvidia 的内核模块。

调用 initEvaluator(_tree) 来初始化评估器,这里的 _tree 就是感知到的 gpu 拓扑结构。

调用 loadExtraConfig(config.ExtraConfigPath) 来加载启动时传入的额外参数配置文件。

go wait.Until(alloc.runProcessResult, time.Second, alloc.stopChan) 创建了新的协程来处理分配结果。

recoverInUsed() 是恢复 gpu 分配结果。比如在 gpu-manager 重启之后,之前的 gpu 分配结果都丢失了,但是节点上还有大量的容器正在占用 gpu,这个方法会通过查找节点上存活的容器,通过 docker endpoint, 调用 InspectContainer 获取容器中占用的 device id,然后标记该设备和容器之间的占用关系。

go alloc.checkAllocationPeriodically(alloc.stopChan) 创建新的协程来周期性的检查资源分配情况。如果是 Failed 和 Pending 状态的容器,就根据错误信息检查是否应该删除它们,然后如果这些 pod 的控制器是 deployment 类似的,就尝试删除它们,这样控制器会重新创建这些 pod 进行调度,让这些 pod 恢复到正常运行状态。

启动各种服务

vcuda,vmemory 的 grpc 服务是 device plugin 的机制。metrics service 是提供给 prometheus 调用的,以监控该节点的相关信息。display 服务会打印 gpu 拓扑结构的相关信息。

Device plugin 的注册

Device plugin

这张图是 device plugin 注册的时序图。gpu-manager 的注册方法是:

func (m *managerImpl) RegisterToKubelet() error {
    socketFile := filepath.Join(m.config.DevicePluginPath, types.KubeletSocket)
    dialOptions := []grpc.DialOption{grpc.WithInsecure(), grpc.WithDialer(utils.UnixDial), grpc.WithBlock(), grpc.WithTimeout(time.Second * 5)}

    conn, err := grpc.Dial(socketFile, dialOptions...)
    if err != nil {
        return err
    }
    defer conn.Close()

    client := pluginapi.NewRegistrationClient(conn)

    for _, srv := range m.bundleServer {
        req := &pluginapi.RegisterRequest{
            Version:      pluginapi.Version,
            Endpoint:     path.Base(srv.SocketName()),
            ResourceName: srv.ResourceName(),
            Options:      &pluginapi.DevicePluginOptions{PreStartRequired: true},
        }

        glog.V(2).Infof("Register to kubelet with endpoint %s", req.Endpoint)
        _, err = client.Register(context.Background(), req)
        if err != nil {
            return err
        }
    }

    return nil
}

这里分别注册了 vcuda 和 vmemory。vcuda 和 vmemory 的 Allocate 方法都指向了同一个方法,写在了 service/allocator/nvidia/allocator.go 中。

至此,gpu-manager 的启动流程结束。接下来的 gpu-manager 的职责就是等待 kubelet 通过 grpc 的调用,在容器调度到节点的时候进行资源设备的分配,必要目录的挂载等工作了。具体的可以见下一篇文章

最后,提供一个简单的脑图帮助理解:

gpu-manager-arch

Kubernetes开发知识–device-plugin的实现

什么是 device plugin

Kubernetes 作为一个自动化容器编排系统,在调度 pod 的时候会根据容器需要的资源进行节点的选择,节点的选择会分为预选和优选阶段。预选阶段会根据所有节点上剩余的资源量与 pod 需要的资源量进行对比,选出能够满足需求的节点。通常情况下,这里的资源都会包括 CPU 和 Memory,就像下面这样:

resources:
  requests:
    memory: "64Mi"
    cpu: "250m"
  limits:
    memory: "128Mi"
    cpu: "500m"

但是现在我们有了新的需求,我们有一个 tensorflow 的模型需要借助 tensorflow serving 来部署,同时我们希望采用 GPU 部署的方案以加快模型的在线推算速度。这样我们就需要一个 GPU 的资源并借助 Kubernetes 的调度器将容器调度到有空余 GPU 资源的方案。

在 1.11 版本之前的 Kubernetes 中,提供了 alpha.kubernetes.io/nvidia-gpu 的资源名称来帮助我们根据 GPU 资源调度。但是这也带来了一些问题:

  • Kubernetes 需要维护 NVIDIA GPU 相关的代码,增加了维护成本。
  • NVIDIA GPU 方面的专家不一定熟悉 Kubernetes,这不符合让最擅长的人做最擅长的事的原则。
  • 除了 NVIDIA GPU,还会有其他的计算资源需要支持。

因此,Kubernetes 在 1.8 版本引入了 device plugin 机制,将第三方的计算资源通过插件的方式引入 Kubernetes,并且由第三方厂商自行维护。Kubernetes 社区的活瞬间就轻松了,第三方厂商也开心了。

通过以上的说明,可以总结出 device plugin 主要用来解耦第三方计算资源和 kubernetes 系统,将第三方的计算资源通过插件的方式引入 Kubernetes。当然 cpu 和 memory 除外,毕竟谁还能少了 CPU 和 Memory 呢。

device plugin 能做什么

目前一些常用的 device plugin 有:

我了解的还有腾讯的 Gaia Scheduler,通过 device plugin 实现的 GPU 虚拟化方案。如果 NVIDIA 的 GPU 方案还不够适合你,可以看看腾讯的这个方案:tkestack/gpu-manager

我觉得腾讯的 GPU 虚拟化方案是最能说明 device plugin 使用场景的例子,通过定义 tencent.com/vcuda-coretencent.com/vcuda-memory 这两个计算资源,来将一个物理 GPU 划分成多个虚拟 GPU 进行调度,这样可以实现一个 GPU 上部署多个 tensorflow serving。你不需要购买特殊的硬件或者修改任何 Kubernetes 的代码,就有了 GPU 虚拟化的能力。

下面我们开个脑洞,现在我们有了一种叫做 cola 的计算资源,可以提高程序的 IO 能力。但是 cola 的资源有限,只分配给特定的容器使用。这时候我们就可以通过实现自己的 device plugin 来满足这个需求。我们的计算资源名就叫做: myway5.com/cola,在下面一小节做具体的实现。

device plugin 的实现方案

device plugin 的工作原理其实不复杂。主要有以下步骤:

  • 首先 device plugin 可以通过手动或 daemonset 部署到需要的节点上。
  • 为了让 Kubernetes 发现 device plugin,需要向 kubelet 的 unix socket。 进行注册,注册的信息包括 device plugin 的 unix socket,API Version,ResourceName。
  • kubelet 通过 grpc 向 device plugin 调用 ListAndWatch, 获取当前节点上的资源。
  • kubelet 向 api server 更新节点状态来通知资源变更。
  • 用户创建 pod,请求资源并调度到节点上后,kubelet 调用 device plugin 的 Allocate 进行资源分配。

时序图如下:

device plugins

在 device plugin 的实现中,最关键的两个要实现的方法是 ListAndWatchAllocate。除此之外,还要注意监控 kubelet 的重启,一般是使用 fsnotify 类似的库监控 kubelet.sock 的重新创建事件。如果重新创建了,则认为 kubelet 是重启了,我们需要重新向 kubelet 注册 device plugin。

ListAndWatch

我们上面定义的 myway5.com/cola 资源用 /etc/colas 下的文件代表。每一个文件代表一个可用的资源。因此实现 ListAndWatch 就是查找该文件夹下的文件,然后添加到设备列表发送给 kubelet,之后调用 fsnotify 去监控文件的 CREATEREMOVE 事件。每次设备列表发生变更都重新向 kubelet 发送更新过的设备列表。

// ListAndWatch returns a stream of List of Devices
// Whenever a Device state change or a Device disappears, ListAndWatch
// returns the new list
func (s *ColaServer) ListAndWatch(e *pluginapi.Empty, srv pluginapi.DevicePlugin_ListAndWatchServer) error {
    log.Infoln("ListAndWatch called")
    devs := make([]*pluginapi.Device, len(s.devices))

    i := 0
    for _, dev := range s.devices {
        devs[i] = dev
        i++
    }

    err := srv.Send(&pluginapi.ListAndWatchResponse{Devices: devs})
    if err != nil {
        log.Errorf("ListAndWatch send device error: %v", err)
        return err
    }

    // 更新 device list
    for {
        log.Infoln("waiting for device change")
        select {
        case <-s.notify:
            log.Infoln("开始更新device list, 设备数:", len(s.devices))
            devs := make([]*pluginapi.Device, len(s.devices))

            i := 0
            for _, dev := range s.devices {
                devs[i] = dev
                i++
            }

            srv.Send(&pluginapi.ListAndWatchResponse{Devices: devs})
        }
    }
}

Allocate

在用户创建的 Pod 请求资源时,Kubernetes 的调度器会进行调度,并通过 kubelet 向 device plugin 发出 Allocate 调用,这一步的调用主要是为了让 device plugin 为容器调度资源。 在调度成功后向 kubelet 返回调度结果即可。

// Allocate is called during container creation so that the Device
// Plugin can run device specific operations and instruct Kubelet
// of the steps to make the Device available in the container
func (s *ColaServer) Allocate(ctx context.Context, reqs *pluginapi.AllocateRequest) (*pluginapi.AllocateResponse, error) {
    log.Infoln("Allocate called")
    resps := &pluginapi.AllocateResponse{}
    for _, req := range reqs.ContainerRequests {
        log.Infof("received request: %v", strings.Join(req.DevicesIDs, ","))
        resp := pluginapi.ContainerAllocateResponse{
            Envs: map[string]string{
                "COLA_DEVICES": strings.Join(req.DevicesIDs, ","),
            },
        }
        resps.ContainerResponses = append(resps.ContainerResponses, &resp)
    }
    return resps, nil
}

部署

device plugin 可以手动部署到机器上,也可以通过 Daemonset 进行部署。这里当然是 Daemonset 进行部署了。部署的时候有几个注意事项:

  • 需要挂载 hostPath,其中 /var/lib/kubelet/device-plugins 是必须的。这个文件夹下有 kubelet.sock,以及我们也需要将 device plugin 的 unix socket 文件存在这里。使得 kubelet 可以和我们的应用通信。
  • 为 device plugin 的 Pod 设置调度优先级别,通常设置成 priorityClassName: "system-node-critical"。这样可以保证不会因为节点利用率过高被逐出。
  • 如果资源设备不是每台机器都有,建议使用 nodeSelector 将 device plugin 调度到指定的机器上。

device plugin 的开发源代码可以参考上面的 cola 例子:cola device plugin

部署结束之后,可以查看一下节点的资源情况:

$ kubectl describe nodes test
Capacity:
 cpu:                2
 ephemeral-storage:  17784752Ki
 hugepages-2Mi:      0
 memory:             1986740Ki
 myway5.com/cola:    2
 pods:               110
Allocatable:
 cpu:                2
 ephemeral-storage:  17784752Ki
 hugepages-2Mi:      0
 memory:             1986740Ki
 myway5.com/cola:    2
 pods:               110

创建一个 pod,请求 myway5.com/cola 资源:

$ kubectl apply -f e2e/pod-with-cola.yaml

然后查看一下 cola pod 的日志来了解设备发现和调度情况:

$ kubectl -n kube-system logs cola-thtm9 
time="2020-03-24T08:16:53Z" level=info msg="cola device plugin starting"
time="2020-03-24T08:16:53Z" level=info msg="find device 'cocacola'"
time="2020-03-24T08:16:53Z" level=info msg="find device 'peisicola'"
time="2020-03-24T08:16:53Z" level=info msg="watching devices"
time="2020-03-24T08:16:53Z" level=info msg="start GPPC server for 'myway5.com/cola'"
time="2020-03-24T08:16:53Z" level=info msg="Register to kubelet with endpoint cola.sock"
time="2020-03-24T08:16:53Z" level=info msg="register to kubelet successfully"
time="2020-03-24T08:16:53Z" level=info msg="ListAndWatch called"
time="2020-03-24T08:16:53Z" level=info msg="waiting for device change"
time="2020-03-24T08:17:10Z" level=info msg="Allocate called"

Kubernetes 开发知识–Kubernetes 准入控制与 admission webhook 的使用

一、什么是准入控制

我们都知道 Kubernetes 的最核心组件就是它的 API Server,所有资源的创建、更新和删除都是通过 API Server 进行的。我们可以通过 HTTP 请求或者 kubectl 这样的客户端来和 APIServer 通信,在我们操作对象的请求到达 API Server 之前,会先到达准入控制器这里。准入控制器可以执行“验证”和“变更”操作。因此我们可以认为有两种准入控制器:变更(mutating)准入控制器验证(validating)准入控制器

准入控制过程也同样分为两个阶段。第一阶段,运行变更准入控制器,对对象进行修改操作;第二阶段,运行验证准入控制器。如果任何一个阶段的任何控制器拒绝了该请求,则整个请求将立即被拒绝,并向终端用户返回一个错误。

我们可以通过下面的图来直观的感受一下:

Kubernetes 开发知识--Kubernetes 准入控制与 admission webhook 的使用

二、准入控制能做什么

准入控制存在的目的就是提高 Kubernetes 架构的灵活性。因此 Kubernetes 提供了一些准入控制器,并且允许你打开或关闭一部分,同时你也可以自定义准入控制器,来完成你自己的一些特殊需求。可以自定义的准入控制器也分为两种:一个叫 MutatingAdmissionWebhook,一个叫 ValidatingAdmissionWebhook,其实也是我们上面说的变更准入控制器验证准入控制器

Kubernetes 提供了一些常用的准入控制器,下面举几个例子:

  • AlwaysPullImages: 该准入控制器会修改每一个新创建的 Pod 的镜像拉取策略为 Always。这样在多租户集群里,用户就能保证自己的私有镜像只会在有凭证的情况下使用,而不会出现因为机器上缓存了镜像而被其他用户直接使用的情况。

  • NamespaceLifecycle:该准入控制器禁止在一个正在被终止的 Namespace 中创建新对象,并且确保使用不存在的 Namespace 的请求被拒绝。该准入控制器还会禁止删除三个系统保留的命名空间,即 defaultkube-systemkube-public

除了 Kubernetes 提供的这些准入控制器,我们可以编写 MutatingAdmissionWebhookValidatingAdmissionWebhook。比如我之前有写一个叫做 [lazykube](https://github.com/joyme123/lazykube)MutatingAdmissionWebhook,它的作用是对每一个创建的 Pod 的镜像源都进行校验,如果是 docker hub, gcr.io, quay.io 等地址的镜像,就修改成国内的代理源,这样就可以自动解决镜像需要翻墙下载的问题了。

三、如何使用 admission webhook 编写一个准入控制器

使用 admission webhook 编写一个准入控制器其实很简单,它就和你日常写 web server 一样:

// Start 启动服务
func (whsrv *WebhookServer) Start() error {
    mux := http.NewServeMux()
    mux.HandleFunc("/mutate", whsrv.serve)
    whsrv.server.Handler = mux

    if err := whsrv.server.ListenAndServeTLS("", ""); err != nil {
        return fmt.Errorf("Failed to listen and serve webhook server: %v", err)
    }

    return nil
}

在收到一个 AdmissionReview 请求的时候,将其中的 AdmissionRequest 对象携带的资源对象取出来进行校验或变更:

var body []byte
if r.Body != nil {
    if data, err := ioutil.ReadAll(r.Body); err == nil {
        body = data
    }
}

if len(body) == 0 {
    log.Error("empty body")
    http.Error(w, "empty body", http.StatusBadRequest)
    return
}

// verify the content type is accurate
contentType := r.Header.Get("Content-Type")
if contentType != "application/json" {
    log.Errorf("Content-Type=%s, expect application/json", contentType)
    http.Error(w, "invalid Content-Type, expect `application/json`", http.StatusUnsupportedMediaType)
    return
}

var admissionResponse *v1beta1.AdmissionResponse
ar := v1beta1.AdmissionReview{}
if _, _, err := deserializer.Decode(body, nil, &ar); err != nil {
    log.Errorf("Can't decode body: %v", err)
    admissionResponse = &v1beta1.AdmissionResponse{
        Result: &metav1.Status{
            Message: err.Error(),
        },
    }
} else {
    admissionResponse = whsrv.mutate(&ar)
}

然后生成 AdmissionResponse, 通过 AdmissionReview 进行响应即可:

admissionReview := v1beta1.AdmissionReview{}
if admissionResponse != nil {
    admissionReview.Response = admissionResponse
    if ar.Request != nil {
        admissionReview.Response.UID = ar.Request.UID
    }
}

resp, err := json.Marshal(admissionReview)
if err != nil {
    log.Errorf("Can't encode response: %v", err)
    http.Error(w, fmt.Sprintf("could not encode response: %v", err), http.StatusInternalServerError)
}
log.Infoln("Ready to write response ...")
if _, err := w.Write(resp); err != nil {
    log.Errorf("Can't write response: %v", err)
    http.Error(w, fmt.Sprintf("could not write response: %v", err), http.StatusInternalServerError)
}

完整的代码可以参考上面的 lazykube 项目。

这样我们写好之后就可以开始部署了。我们需要告诉 Kubernetes 我们的 admission webhook 的地址,以及我们要操作的资源对象,因此我们创建一个 MutatingWebhookConfiguration 或者 ValidatingWebhookConfiguration 对象,比如 lazykube 就是对创建 Pod 进行变更操作:

apiVersion: admissionregistration.k8s.io/v1beta1
kind: MutatingWebhookConfiguration
metadata:
  name: lazykube-webhook-cfg
  namespace: kube-system
  labels:
    app: lazykube
webhooks:
  - name: lazykube.myway5.com
    clientConfig:
      service:
        name: lazykube-webhook-svc
        namespace: kube-system
        path: "/mutate"
      caBundle: ××××××××
    rules:
      - operations: [ "CREATE" ]
        apiGroups: [""]
        apiVersions: ["v1"]
        resources: ["pods"]

然后为了让 Kubernetes 通过 HTTPS 进行通信,并信任我们的证书,我们需要让 Kubernetes 集群为我们的签发证书。具体的方法可以参考这里:kubernetes 集群中的证书签发。最后使用 Deployment 部署我们的服务即可。